
Geography of Beijing
| Geography of Beijing | |
.svg) | |
 | |
| Continent | Asia |
| Location | North China Plain |
| Coordinates | 39°54′N 116°24′E / 39.900°N 116.400°E |
| Area (municipality) | Total: 16,801 square kilometres (6,487 sq mi) |
Beijing Municipality consists of six city districts (previously eight, see
Historically, Beijing was situated on the border between
Layout of Beijing's administrative divisions
In imperial times, the old walled city of Beijing occupied 62 km2 (24 sq mi).[1] The physical size of the city has grown more than tenfold in recent decades to about 750 km2 (290 sq mi). The inner suburbs (1,282 km2 or 495 sq mi), and outer suburbs (3,198 km2 or 1,235 sq mi) provide further space for growth.[1] The remaining 12,239.9 km2 (4,725.9 sq mi) of the municipality consists of rural areas, nature reserves and lightly populated mountains.[1]

Two urban districts,
The inner city is divided into eastern and western halves by Dongcheng and Xicheng Districts. The
Beyond the 2nd Ring Road, the city spreads out in a checkerboard fashion marked by concentric ring roads. Four other districts,
Of the suburban districts further afield,
Far north of the municipality in the Yanshan range are in Miyun, and Jiangjunguan in Pinggu.
Topography

The city of Beijing lies on low and flat land, with elevation generally between 40–60 metres (130–200 ft) above sea level. The highest point inside the old walled city is at the top of Coal Hill in

To the west is Xishan, also known as the Western Hills, which are visible from the city on clear days. Xishan forms the eastern flank of the Taihang Mountains range, which run north–south up the spine of Hebei province.[5] Xishan covers nearly all of Fangshan and Mentougou Districts west of the city. East Lingshan (elevation 2,303 metres (7,556 ft)), a Xishan peak on the border with Hebei, is the highest point in Beijing Municipality.[5] It is located 122 km (76 mi) from the city. Xishan is also known for high mountain meadows and scenic river gorges, including Shidu. Foothills of Xishan reach the city itself. They include Fragrant Hills, a major tourist attraction and Laoshan, the site of mountain bike competition in the 2008 Summer Olympics.

The mountains north of Beijing including
The Yanshan and Xishan ranges meet at Nankou, in Changping District, northwest of the city. The intersection creates a massive fault line and rift valley through which the city's main roads and railroads to the northwest pass.
Hydrology

Several major
, which provide water to the city and drain its refuse, but no longer threaten Beijing with flooding.
Downtown Beijing has several

_in_summer.JPG)
Today, an aqueduct draws water from the Yongding through Yuyuantan Park to the western city moat, which empties into Liangshui River south of the city. Another aqueduct draws water from Kunming Lake in the Summer Palace down through the Purple Bamboo Park and into the northern city moat, which also replenishes Shichahai, Beihai and Zhongnanhai. The northern moats are drained by the Ba River, which flows into the Wenyu River. The southern and eastern moats are drained by the Tonghui River, which also flow into the Wenyu.
This network of rivers and aqueducts are fed by
Climate
| Beijing | ||||||||||||||||||||||||||||||||||||||||||||||||||||||||||||
|---|---|---|---|---|---|---|---|---|---|---|---|---|---|---|---|---|---|---|---|---|---|---|---|---|---|---|---|---|---|---|---|---|---|---|---|---|---|---|---|---|---|---|---|---|---|---|---|---|---|---|---|---|---|---|---|---|---|---|---|---|
| Climate chart (explanation) | ||||||||||||||||||||||||||||||||||||||||||||||||||||||||||||
| ||||||||||||||||||||||||||||||||||||||||||||||||||||||||||||
| ||||||||||||||||||||||||||||||||||||||||||||||||||||||||||||
The city's
| Climate data for Beijing (1991–2020 normals, extremes 1951–present) | |||||||||||||
|---|---|---|---|---|---|---|---|---|---|---|---|---|---|
| Month | Jan | Feb | Mar | Apr | May | Jun | Jul | Aug | Sep | Oct | Nov | Dec | Year |
| Record high °C (°F) | 14.3 (57.7) |
25.6 (78.1) |
29.5 (85.1) |
33.5 (92.3) |
41.1 (106.0) |
41.1 (106.0) |
41.9 (107.4) |
39.3 (102.7) |
35.2 (95.4) |
31.0 (87.8) |
23.3 (73.9) |
19.5 (67.1) |
41.9 (107.4) |
| Mean daily maximum °C (°F) | 2.3 (36.1) |
6.1 (43.0) |
13.2 (55.8) |
21.0 (69.8) |
27.2 (81.0) |
30.8 (87.4) |
31.8 (89.2) |
30.7 (87.3) |
26.5 (79.7) |
19.3 (66.7) |
10.3 (50.5) |
3.7 (38.7) |
18.6 (65.4) |
| Daily mean °C (°F) | −2.7 (27.1) |
0.6 (33.1) |
7.5 (45.5) |
15.1 (59.2) |
21.3 (70.3) |
25.3 (77.5) |
27.2 (81.0) |
26.1 (79.0) |
21.2 (70.2) |
13.8 (56.8) |
5.2 (41.4) |
−1.0 (30.2) |
13.3 (55.9) |
| Mean daily minimum °C (°F) | −6.9 (19.6) |
−4.2 (24.4) |
1.9 (35.4) |
9.0 (48.2) |
15.1 (59.2) |
20.0 (68.0) |
23.0 (73.4) |
22.0 (71.6) |
16.3 (61.3) |
8.8 (47.8) |
0.7 (33.3) |
−5.0 (23.0) |
8.4 (47.1) |
| Record low °C (°F) | −22.8 (−9.0) |
−27.4 (−17.3) |
−15 (5) |
−3.2 (26.2) |
2.5 (36.5) |
9.8 (49.6) |
15.3 (59.5) |
11.4 (52.5) |
3.7 (38.7) |
−3.5 (25.7) |
−12.3 (9.9) |
−18.3 (−0.9) |
−27.4 (−17.3) |
| Average precipitation mm (inches) | 2.2 (0.09) |
5.8 (0.23) |
8.6 (0.34) |
21.7 (0.85) |
36.1 (1.42) |
72.4 (2.85) |
169.7 (6.68) |
113.4 (4.46) |
53.7 (2.11) |
28.7 (1.13) |
13.5 (0.53) |
2.2 (0.09) |
528 (20.78) |
| Average precipitation days (≥ 0.1 mm) | 1.6 | 2.3 | 3.0 | 4.7 | 6.0 | 10.0 | 11.9 | 10.5 | 7.1 | 5.2 | 2.9 | 1.6 | 66.8 |
| Average snowy days | 2.8 | 2.5 | 1.3 | 0.1 | 0.0 | 0.0 | 0.0 | 0.0 | 0.0 | 0.0 | 1.7 | 2.8 | 11.2 |
| Average relative humidity (%)
|
43 | 42 | 40 | 43 | 47 | 58 | 69 | 71 | 64 | 58 | 54 | 46 | 53 |
| Mean monthly sunshine hours | 188.1 | 189.1 | 231.1 | 243.2 | 265.1 | 221.6 | 190.5 | 205.3 | 206.1 | 199.9 | 173.4 | 177.1 | 2,490.5 |
| Percent possible sunshine | 62 | 62 | 62 | 61 | 59 | 50 | 42 | 49 | 56 | 59 | 59 | 61 | 57 |
| Average ultraviolet index | 2 | 3 | 4 | 6 | 8 | 9 | 9 | 8 | 6 | 4 | 2 | 1 | 5 |
| Source 1: China Meteorological Administration[11][12] | |||||||||||||
| Source 2: Extremes[a] and Weather Atlas[16] | |||||||||||||
Note
| Climate data for Beijing (1981–2010,year record 1951-2016) | |||||||||||||
|---|---|---|---|---|---|---|---|---|---|---|---|---|---|
| Month | Jan | Feb | Mar | Apr | May | Jun | Jul | Aug | Sep | Oct | Nov | Dec | Year |
| Record high °C (°F) | 14.3 (57.7) |
16.1 (61.0) |
29.5 (85.1) |
31.9 (89.4) |
38.1 (100.6) |
39.6 (103.3) |
41.9 (107.4) |
37.3 (99.1) |
35.0 (95.0) |
31.0 (87.8) |
21.6 (70.9) |
13.4 (56.1) |
41.9 (107.4) |
| Mean daily maximum °C (°F) | 1.8 (35.2) |
6.2 (43.2) |
12.8 (55.0) |
20.6 (69.1) |
27.0 (80.6) |
30.7 (87.3) |
32.1 (89.8) |
30.6 (87.1) |
26.6 (79.9) |
19.4 (66.9) |
10.2 (50.4) |
3.5 (38.3) |
18.5 (65.2) |
| Daily mean °C (°F) | −3.0 (26.6) |
0.7 (33.3) |
7.1 (44.8) |
14.8 (58.6) |
21.0 (69.8) |
25.1 (77.2) |
27.3 (81.1) |
25.9 (78.6) |
21.2 (70.2) |
13.9 (57.0) |
5.1 (41.2) |
−1.1 (30.0) |
13.2 (55.7) |
| Mean daily minimum °C (°F) | −7.3 (18.9) |
−4.1 (24.6) |
1.8 (35.2) |
8.9 (48.0) |
15.0 (59.0) |
19.9 (67.8) |
23.1 (73.6) |
21.8 (71.2) |
16.3 (61.3) |
8.9 (48.0) |
0.6 (33.1) |
−5.1 (22.8) |
8.3 (47.0) |
| Record low °C (°F) | −17 (1) |
−14.7 (5.5) |
−8 (18) |
−0.1 (31.8) |
7.7 (45.9) |
9.8 (49.6) |
16.0 (60.8) |
14.6 (58.3) |
7.5 (45.5) |
−3.4 (25.9) |
−9.5 (14.9) |
−13.5 (7.7) |
−27.4 (−17.3) |
| Average precipitation mm (inches) | 2.8 (0.11) |
4.4 (0.17) |
9.9 (0.39) |
23.7 (0.93) |
37.6 (1.48) |
70.5 (2.78) |
159.6 (6.28) |
139.4 (5.49) |
48.7 (1.92) |
23.9 (0.94) |
9.6 (0.38) |
2.0 (0.08) |
532.1 (20.95) |
| Source: China Meteorological Administration[17] | |||||||||||||
Coordinates

With coordinates of 39° 54' 50 N and 116° 23' 30" E, Beijing shares roughly the same latitude as
Beijing's
Maps and satellite images
-
 Beijing's urban extent
 -
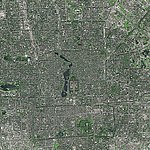 Satellite image of the city of Beijing, with the Forbidden City in the center, just north of Tiananmen Square and east of a string of lakes. Also visible are Yuyuantan lake in the west and the southern city moat, which once surrounded the walled outer city.
 -
 Satellite view of the city within the6th Ring Road
 -
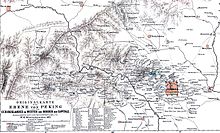 The Beijing area in 1875
 -
 Beijing in 1912
 -
 The old city in 1916
 -
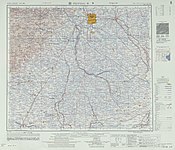 Map of Beijing (labeled as PEI-P’ING (PEIPING) 北平) and nearby areas (1954)
 -
 Beijing and vicinity in 1986
 -
 Map showing the old walled city, including the inner and outer cities


See also
References
- ^ a b c d (Chinese) 北京地理概貌 Archived 2016-03-03 at the Wayback Machine last accessed 11/18/08
- ^ The Beijing Capital Airport and the highway connecting it to the city are administered by Chaoyang District even though the airport is almost completely surrounded by Shunyi District.
- ^ (Chinese) Jingshan Park Archived 2008-08-04 at the Wayback Machine
- ^ (Chinese) Summer Palace Archived 2007-08-14 at the Wayback Machine
- ^ a b c (Chinese) [1] last accessed 11/16/08
- ^ (Chinese)陈平, 三、什刹海与陶然湖、古蓟城[permanent dead link] June 6, 2008
- ^ 中国地面国际交换站气候标准值月值数据集(1981-2010年) (in Chinese). China Meteorological Administration. Archived from the original on 2013-03-18. Retrieved 2015-01-15.
- ^ "Beijing". People's Daily. March 2001. Retrieved 2008-06-22.
- ^ a b "Extreme Temperatures Around the World". Retrieved 2013-02-21.
- ^ "Basic Information". Beijing Municipal Bureau of Statistics. Archived from the original on 2012-03-13. Retrieved 2008-02-09.
- ^ 1991-2020 normals "Climate averages from 1991 to 2020". China Meteorological Administration. Archived from the original on 2023-04-17.
- ^ 1981-2010 extremes 中国气象数据网 – WeatherBk Data (in Simplified Chinese). China Meteorological Administration. Retrieved 14 April 2023.
- ^ 2021 February weather data "Global Surface Summary of the Day - GSOD". National Oceanic and Atmospheric Administration. Archived from the original on 2023-04-30. Retrieved 30 April 2023.
- ^ Burt, Christopher C. "UPDATE June 1: Record May Heat Wave in Northeast China, Koreas". Wunderground. Retrieved 2014-06-01.
- ^ Burt, Christopher C. ": Record June Heat Wave in Northeast China, Koreas". Wunderground. Retrieved 2023-06-23.
- ^ "Beijing, China - Detailed climate information and monthly weather forecast". Weather Atlas. Yu Media Group. Retrieved 2019-07-09.
- ^ 中国地面国际交换站气候标准值月值数据集(1981-2010年) (in Chinese). China Meteorological Administration. Archived from the original on 2013-03-18. Retrieved 2015-01-15.
External links
- "Peking", a map from 1914
| Administration |
|  | ||||||
|---|---|---|---|---|---|---|---|---|
| Economy | ||||||||
| Education | ||||||||
| Transportation |
| |||||||
| Visitor attractions | ||||||||
| Municipal agencies |
| |||||||