
Pontotoc County, Mississippi
Pontotoc County | |
|---|---|
 Pontotoc County Courthouse in Pontotoc | |
|
UTC−5 (CDT) | |
| Congressional district | 1st |
| Website | pontotoccoms |
Pontotoc County is a
Pontotoc County is part of the Tupelo, MS Micropolitan Statistical Area.
Geography
According to the
Major highways
 Interstate 22
 U.S. Route 78
 U.S. Route 278
 Mississippi Highway 6
 Mississippi Highway 9
 Mississippi Highway 15
 Mississippi Highway 41
- Natchez Trace Parkway
Adjacent counties
- Union County (north)
- Lee County (east)
- Chickasaw County (south)
- Calhoun County (southwest)
- Lafayette County (west)
National protected area
- Natchez Trace Parkway (part)
- Tombigbee National Forest (part)
Demographics
| Census | Pop. | Note | %± |
|---|---|---|---|
| 1840 | 4,491 | — | |
| 1850 | 17,112 | 281.0% | |
| 1860 | 22,113 | 29.2% | |
| 1870 | 12,525 | −43.4% | |
| 1880 | 13,858 | 10.6% | |
| 1890 | 14,940 | 7.8% | |
| 1900 | 18,274 | 22.3% | |
| 1910 | 19,688 | 7.7% | |
| 1920 | 19,962 | 1.4% | |
| 1930 | 22,034 | 10.4% | |
| 1940 | 22,904 | 3.9% | |
| 1950 | 19,994 | −12.7% | |
| 1960 | 17,232 | −13.8% | |
| 1970 | 17,363 | 0.8% | |
| 1980 | 20,918 | 20.5% | |
| 1990 | 22,237 | 6.3% | |
| 2000 | 26,726 | 20.2% | |
| 2010 | 29,957 | 12.1% | |
| 2020 | 31,184 | 4.1% | |
| 2023 (est.) | 31,535 | [4] | 1.1% |
| U.S. Decennial Census[5] 1790-1960[6] 1900-1990[7] 1990-2000[8] 2010-2013[9] | |||
2020 census
| Race | Num. | Perc. |
|---|---|---|
White
|
23,859 | 76.51% |
Black or African American
|
4,208 | 13.49% |
Native American
|
56 | 0.18% |
Asian
|
55 | 0.18% |
Pacific Islander
|
5 | 0.02% |
Other/Mixed
|
953 | 3.06% |
Latino
|
2,048 | 6.57% |
As of the
2000 census
As of the
According to the
There were 10,097 households, out of which 37.10% had children under the age of 18 living with them, 59.20% were married couples living together, 11.90% had a female householder with no husband present, and 25.10% were non-families. 22.70% of all households were made up of individuals, and 10.40% had someone living alone who was 65 years of age or older. The average household size was 2.62 and the average family size was 3.08.
In the county, the population was spread out, with 27.60% under the age of 18, 8.70% from 18 to 24, 29.50% from 25 to 44, 21.40% from 45 to 64, and 12.80% who were 65 years of age or older. The median age was 35 years. For every 100 females, there were 94.50 males. For every 100 females age 18 and over, there were 90.80 males.
The median income for a household in the county was $32,055, and the median income for a family was $39,845. Males had a median income of $29,074 versus $21,350 for females. The
Communities
City
- Pontotoc (county seat)
Towns
- Algoma
- Ecru
- Sherman (partly in Union County and Lee County)
- Thaxton
- Toccopola
Census-designated place
Unincorporated communities
- Endville
- Esperanza
- Furrs
- Hurricane
- Rough Edge
- Springville
- Troy
Politics
| Year | Republican | Democratic | Third party | |||
|---|---|---|---|---|---|---|
| No. | % | No. | % | No. | % | |
| 2020 | 11,550 | 80.43% | 2,614 | 18.20% | 197 | 1.37% |
| 2016 | 10,336 | 79.61% | 2,386 | 18.38% | 262 | 2.02% |
| 2012 | 9,448 | 76.13% | 2,804 | 22.59% | 159 | 1.28% |
| 2008 | 9,727 | 75.59% | 2,982 | 23.17% | 159 | 1.24% |
| 2004 | 8,480 | 75.44% | 2,660 | 23.67% | 100 | 0.89% |
| 2000 | 6,601 | 69.41% | 2,771 | 29.14% | 138 | 1.45% |
| 1996 | 4,289 | 55.64% | 2,597 | 33.69% | 823 | 10.68% |
| 1992 | 4,595 | 54.92% | 2,965 | 35.44% | 806 | 9.63% |
| 1988 | 4,939 | 63.81% | 2,772 | 35.81% | 29 | 0.37% |
| 1984 | 5,182 | 67.80% | 2,434 | 31.85% | 27 | 0.35% |
| 1980 | 3,198 | 40.99% | 4,499 | 57.66% | 105 | 1.35% |
| 1976 | 2,245 | 34.59% | 4,066 | 62.64% | 180 | 2.77% |
| 1972 | 4,476 | 89.45% | 488 | 9.75% | 40 | 0.80% |
| 1968 | 733 | 11.96% | 599 | 9.77% | 4,798 | 78.27% |
| 1964 | 2,699 | 79.36% | 702 | 20.64% | 0 | 0.00% |
| 1960 | 328 | 12.13% | 1,584 | 58.58% | 792 | 29.29% |
| 1956 | 335 | 11.91% | 2,320 | 82.50% | 157 | 5.58% |
| 1952 | 648 | 22.12% | 2,281 | 77.88% | 0 | 0.00% |
| 1948 | 28 | 1.46% | 348 | 18.17% | 1,539 | 80.37% |
| 1944 | 87 | 4.83% | 1,716 | 95.17% | 0 | 0.00% |
| 1940 | 70 | 3.12% | 2,171 | 96.75% | 3 | 0.13% |
| 1936 | 93 | 3.89% | 2,286 | 95.73% | 9 | 0.38% |
| 1932 | 31 | 1.63% | 1,862 | 98.00% | 7 | 0.37% |
| 1928 | 261 | 14.52% | 1,537 | 85.48% | 0 | 0.00% |
| 1924 | 86 | 6.66% | 1,206 | 93.34% | 0 | 0.00% |
| 1920 | 439 | 30.32% | 992 | 68.51% | 17 | 1.17% |
| 1916 | 110 | 7.71% | 1,314 | 92.08% | 3 | 0.21% |
| 1912 | 47 | 3.98% | 1,009 | 85.44% | 125 | 10.58% |
Education
There are two school districts:
See also
- Dry counties
- List of counties in Mississippi
- National Register of Historic Places listings in Pontotoc County, Mississippi
References
- ^ "Census - Geography Profile: Pontotoc County, Mississippi". United States Census Bureau. Retrieved January 14, 2023.
- ^ "Find a County". National Association of Counties. Retrieved June 7, 2011.
- ^ "2010 Census Gazetteer Files". United States Census Bureau. August 22, 2012. Archived from the original on September 28, 2013. Retrieved November 6, 2014.
- ^ "Annual Estimates of the Resident Population for Counties: April 1, 2020 to July 1, 2023". United States Census Bureau. Retrieved April 5, 2024.
- ^ "U.S. Decennial Census". United States Census Bureau. Retrieved November 6, 2014.
- ^ "Historical Census Browser". University of Virginia Library. Retrieved November 6, 2014.
- ^ "Population of Counties by Decennial Census: 1900 to 1990". United States Census Bureau. Retrieved November 6, 2014.
- ^ "Census 2000 PHC-T-4. Ranking Tables for Counties: 1990 and 2000" (PDF). United States Census Bureau. Archived (PDF) from the original on March 27, 2010. Retrieved November 6, 2014.
- ^ "State & County QuickFacts". United States Census Bureau. Archived from the original on January 15, 2016. Retrieved September 5, 2013.
- ^ "Explore Census Data". data.census.gov. Retrieved December 8, 2021.
- ^ a b "U.S. Census website". United States Census Bureau. Retrieved January 31, 2008.
- ^ Leip, David. "Dave Leip's Atlas of U.S. Presidential Elections". uselectionatlas.org. Retrieved March 5, 2018.
- OCLC 1645522. Retrieved July 5, 2019.
34°14′N 89°02′W / 34.23°N 89.04°W
Places adjacent to Pontotoc County, Mississippi | ||||||||||||||||
|---|---|---|---|---|---|---|---|---|---|---|---|---|---|---|---|---|
| ||||||||||||||||
Municipalities and communities of Pontotoc County, Mississippi, United States | ||
|---|---|---|
| City | 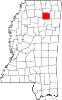 | |
| Towns | ||
| CDP | ||
| Other communities |
| |
| Footnotes | ‡This populated place also has portions in an adjacent county or counties | |
| ||
| International | |
|---|---|
| National | |
| Geographic | |
| Other | |