
Anderson County, Kentucky
Anderson County | |
|---|---|
UTC−4 (EDT) | |
| Congressional districts | 1st, 6th |
| Website | andersoncounty |
Anderson County, located in the Outer Bluegrass physiographic region, is Kentucky's 48th most populated and ninth fastest-growing county.[1]
Anderson County's estimated population as of July 1, 2022, is 24,224, a 1.6% increase from April 1, 2020, and a 13.1% increase from April 1, 2010.[2]
On January 16, 1827, the
Anderson County's 202.17 square miles comprises 25 GNIS-designated populated places, with Lawrenceburg as its largest city in population and size. In addition to its inclusion in the Outer Bluegrass region, Anderson County is part of the Bluegrass Area Development District and the Frankfort Micropolitan Statistical Area.[4]
Geography
GNIS numeric designators:
- "Kentucky" = 21
- "Anderson County" = 5
Populated places
| feature_id | feature_name | map_name | date_created | date_edited |
|---|---|---|---|---|
| 485900 | Alton | Alton Station | 1979-09-20 | 2022-06-07 |
| 485902 | Alton Station | Alton Station | 1979-09-20 | 2022-06-07 |
| 486076 | Ashbrook | Ashbrook | 1979-09-20 | 2022-06-07 |
| 486157 | Avenstoke | Glensboro | 1979-09-20 | 2022-06-07 |
| 487337 | Birdie | Glensboro | 1979-09-20 | 2022-06-07 |
| 491894 | Fairview | Ashbrook | 1979-09-20 | 2022-06-07 |
| 492406 | Fox Creek | McBrayer | 1979-09-20 | 2022-06-07 |
| 492908 | Glensboro | Glensboro | 1979-09-20 | 2022-06-07 |
| 496081 | Lawrenceburg | Alton Station | 1979-09-20 | 2022-06-07 |
| 497764 | McBrayer | McBrayer | 1979-09-20 | 2022-06-07 |
| 499488 | Ninevah | Alton Station | 1979-09-20 | 2022-06-07 |
| 503551 | Sinai | Ashbrook | 1979-09-20 | 2022-06-07 |
| 504588 | Stringtown | Alton Station | 1979-09-20 | 2022-06-07 |
| 505753 | Tyrone | Tyrone | 1979-09-20 | 2022-06-07 |
| 505955 | Van Buren | Chaplin | 1979-09-20 | 2022-06-07 |
| 507398 | Anderson City | Glensboro | 1979-09-20 | 2022-06-07 |
| 507444 | Ballard | McBrayer | 1979-09-20 | 2022-06-07 |
| 507878 | Drydock | Ashbrook | 1979-09-20 | 2022-06-07 |
| 508078 | Gee | Glensboro | 1979-09-20 | 2022-06-07 |
| 508230 | Hickory Grove | McBrayer | 1979-09-20 | 2022-06-07 |
| 508351 | Johnsonville | Ashbrook | 1979-09-20 | 2022-06-07 |
| 508401 | Klondyke | Ashbrook | 1979-09-20 | 2022-06-07 |
| 508691 | Nevin | McBrayer | 1979-09-20 | 2022-06-07 |
| 509103 | Sparrow | Chaplin | 1979-09-20 | 2022-06-07 |
| 509327 | Wayside | Glensboro | 1979-09-20 | 2022-06-07 |
| 2566547 | Houchin (historical) | Salvisa | November 8, 2009 | July 6, 2022 |
| 2566549 | Jefferies (historical) | Ashbrook | November 8, 2009 | July 6, 2022 |
| 2566561 | Pleasant Grove (historical) | Glensboro | November 8, 2009 | July 6, 2022 |
| 2566571 | Sidney (historical) | McBrayer | November 8, 2009 | July 6, 2022 |
Adjacent counties
- Franklin County (north)
- Woodford County (east)
- Mercer County (southeast)
- Washington County (south)
- Nelson County (southwest)
- Spencer County (west)
- Shelby County (northwest)
Demographics
| Census | Pop. | Note | %± |
|---|---|---|---|
| 1830 | 4,520 | — | |
| 1840 | 5,452 | 20.6% | |
| 1850 | 6,260 | 14.8% | |
| 1860 | 7,404 | 18.3% | |
| 1870 | 5,449 | −26.4% | |
| 1880 | 9,361 | 71.8% | |
| 1890 | 10,610 | 13.3% | |
| 1900 | 10,051 | −5.3% | |
| 1910 | 10,146 | 0.9% | |
| 1920 | 9,982 | −1.6% | |
| 1930 | 8,494 | −14.9% | |
| 1940 | 8,936 | 5.2% | |
| 1950 | 8,984 | 0.5% | |
| 1960 | 8,618 | −4.1% | |
| 1970 | 9,358 | 8.6% | |
| 1980 | 12,567 | 34.3% | |
| 1990 | 14,571 | 15.9% | |
| 2000 | 19,111 | 31.2% | |
| 2010 | 21,421 | 12.1% | |
| 2020 | 23,852 | 11.3% | |
| 2023 (est.) | 24,613 | [6] | 3.2% |
| U.S. Decennial Census[7] 1790-1960[8] 1900-1990[9] 1990-2000[10] 2010-2020[11] | |||
As of the
There were 8,694 households, of which 33.80% had children under the age of 18 living with them, 50.2% were married couples living together, 27.1% had a female householder with no husband present. 32.79% of all households were made up of individuals without children, and 12.1% had someone living alone who was 65 years of age or older. The average household size was 2.57 and the average family size was 3.03.
Age distribution was 23.5% under the age of 18, 11.8% from 15 to 24, 24.3% from 25 to 44, 28.9% from 45 to 64, and 16.3% who were 65 years of age or older. The median age was 41.4 years and the population is estimated to be 51% Female and 49% Male.
The
| Population | |
|---|---|
| Population Estimates, July 1, 2022, (V2022) | 24,224 |
| Population estimates base, April 1, 2020, (V2022) | 23,851 |
| Population, percent change - April 1, 2020 (estimates base) to July 1, 2022, (V2022) | 1.6% |
| Population, Census, April 1, 2020 | 23,852 |
| Population, Census, April 1, 2010 | 21,421 |
| Age & Sex | |
| Persons under 5 years, percent | 5.5% |
| Persons under 18 years, percent | 22.9% |
| Persons 65 years and over, percent | 16.8% |
| Female persons, percent | 50.3% |
| Race & Hispanic Origin | |
| White alone, percent | 94.6% |
| Black or African American alone, percent | 2.4% |
| American Indian and Alaska Native alone, percent | 0.3% |
| Asian alone, percent | 0.7% |
| Native Hawaiian and Other Pacific Islander alone, percent | 0.1% |
| Two or More Races, percent | 1.9% |
| Hispanic or Latino, percent | 2.5% |
| White alone, not Hispanic or Latino, percent | 92.6% |
| Population Characteristics | |
| Veterans, 2017–2021 | 1,066 |
| Foreign born persons, percent, 2017–2021 | 1.4% |
| Housing | |
| Housing units, July 1, 2022, (V2022) | 10,309 |
| Owner-occupied housing unit rate, 2017–2021 | 79.0% |
| Median value of owner-occupied housing units, 2017–2021 | $169,400 |
| Median selected monthly owner costs -with a mortgage, 2017–2021 | $1,225 |
| Median selected monthly owner costs -without a mortgage, 2017–2021 | $375 |
| Median gross rent, 2017–2021 | $776 |
| Building permits, 2022 | 192 |
| Families & Living Arrangements | |
| Households, 2017–2021 | 9,063 |
| Persons per household, 2017–2021 | 2.60 |
| Living in same house 1 year ago, percent of persons age 1 year+, 2017–2021 | 88.2% |
| Language other than English spoken at home, percent of persons age 5 years+, 2017–2021 | 1.9% |
| Computer & Internet Use | |
| Households with a computer, percent, 2017–2021 | 92.2% |
| Households with a broadband Internet subscription, percent, 2017–2021 | 85.6% |
| Education | |
| High school graduate or higher, percent of persons age 25 years+, 2017–2021 | 91.1% |
| Bachelor's degree or higher, percent of persons age 25 years+, 2017–2021 | 25.3% |
| Health | |
| With a disability, under age 65 years, percent, 2017–2021 | 15.4% |
| Persons without health insurance, under age 65 years, percent | 7.2% |
| Economy | |
| In civilian labor force, total, percent of population age 16 years+, 2017–2021 | 61.0% |
| In civilian labor force, female, percent of population age 16 years+, 2017–2021 | 58.7% |
| Total accommodation and food services sales, 2017 ($1,000) | 24,462 |
| Total health care and social assistance receipts/revenue, 2017 ($1,000) | 24,331 |
| Total transportation and warehousing receipts/revenue, 2017 ($1,000) | 334 |
| Total retail sales, 2017 ($1,000) | 237,836 |
| Total retail sales per capita, 2017 | $10,546 |
| Transportation | |
| Mean travel time to work (minutes), workers age 16 years+, 2017–2021 | 27.4 |
| Income & Poverty | |
| Median household income (in 2021 dollars), 2017–2021 | $59,887 |
| Per capita income in past 12 months (in 2021 dollars), 2017–2021 | $30,294 |
| Persons in poverty, percent | 9.0% |
Politics
Voter registration
| Anderson County Voter Registration & Party Enrollment as of September 15, 2021[13] | |||||
|---|---|---|---|---|---|
| Political Party | Total Voters | Percentage | |||
| Republican | 9,096 | 48.11% | |||
| Democratic | 8,401 | 44.33% | |||
| Others | 743 | 3.93% | |||
| Independent | 595 | 3.15% | |||
| Libertarian | 66 | 0.35% | |||
Green
|
2 | 0.01% | |||
| Total | 15,760 | 100% | |||
Election results
| Year | Republican | Democratic | Third party | |||
|---|---|---|---|---|---|---|
| No. | % | No. | % | No. | % | |
| 2020 | 9,661 | 72.89% | 3,348 | 25.26% | 245 | 1.85% |
| 2016 | 8,242 | 72.16% | 2,634 | 23.06% | 546 | 4.78% |
| 2012 | 6,822 | 66.10% | 3,315 | 32.12% | 183 | 1.77% |
| 2008 | 6,885 | 65.25% | 3,462 | 32.81% | 205 | 1.94% |
| 2004 | 6,363 | 66.34% | 3,141 | 32.75% | 87 | 0.91% |
| 2000 | 4,909 | 61.62% | 2,902 | 36.43% | 156 | 1.96% |
| 1996 | 2,972 | 44.67% | 2,898 | 43.56% | 783 | 11.77% |
| 1992 | 2,731 | 42.20% | 2,491 | 38.49% | 1,250 | 19.31% |
| 1988 | 3,225 | 59.17% | 2,176 | 39.93% | 49 | 0.90% |
| 1984 | 3,425 | 66.06% | 1,717 | 33.11% | 43 | 0.83% |
| 1980 | 2,052 | 43.07% | 2,567 | 53.88% | 145 | 3.04% |
| 1976 | 1,682 | 40.71% | 2,388 | 57.79% | 62 | 1.50% |
| 1972 | 2,298 | 62.62% | 1,302 | 35.48% | 70 | 1.91% |
| 1968 | 1,594 | 44.33% | 1,334 | 37.10% | 668 | 18.58% |
| 1964 | 1,085 | 30.26% | 2,491 | 69.46% | 10 | 0.28% |
| 1960 | 2,033 | 49.94% | 2,038 | 50.06% | 0 | 0.00% |
| 1956 | 1,878 | 47.27% | 2,089 | 52.58% | 6 | 0.15% |
| 1952 | 1,445 | 40.06% | 2,153 | 59.69% | 9 | 0.25% |
| 1948 | 971 | 30.32% | 2,135 | 66.68% | 96 | 3.00% |
| 1944 | 1,409 | 39.37% | 2,148 | 60.02% | 22 | 0.61% |
| 1940 | 1,244 | 33.01% | 2,515 | 66.73% | 10 | 0.27% |
| 1936 | 1,360 | 35.56% | 2,454 | 64.16% | 11 | 0.29% |
| 1932 | 1,184 | 32.58% | 2,415 | 66.46% | 35 | 0.96% |
| 1928 | 1,859 | 51.96% | 1,718 | 48.02% | 1 | 0.03% |
| 1924 | 1,419 | 39.84% | 2,089 | 58.65% | 54 | 1.52% |
| 1920 | 1,819 | 42.01% | 2,499 | 57.71% | 12 | 0.28% |
| 1916 | 1,065 | 40.76% | 1,521 | 58.21% | 27 | 1.03% |
| 1912 | 579 | 24.16% | 1,391 | 58.03% | 427 | 17.81% |
Communities
Ghost towns
See also
References
- ^ Cubit, “Kentucky Counties by Population,” Kentucky Demographics, accessed July 15, 2023, https://www.kentucky-demographics.com/counties_by_population; David C. Elbon, “Anderson County, Kentucky,” Kentucky Atlas and Gazetteer, accessed July 15, 2023, https://www.kyatlas.com/21005.html; Bailey Loosemore, “The 2020 Census Results Show Us These Kentucky Counties Grew the Most in the Past Decade,” The Courier-Journal, August 16, 2021, accessed July 15, 2023, https://www.courier-journal.com/story/news/local/.
- ^ U.S. Census Bureau, “People - Anderson County, Kentucky,” QuickFacts, Vintage 2022, accessed July 15, 2023, https://www.census.gov/quickfacts/fact/table/andersoncountykentucky/PST045222.
- ^ "Kentucky: Secretary of State - Land Office". web.sos.ky.gov. Retrieved January 11, 2024.
- ^ U.S. Census Bureau, “Geography - Anderson County, Kentucky,” QuickFacts, Vintage 2022, https://www.census.gov/quickfacts/fact/table/andersoncountykentucky/PST045222; Kentucky Cabinet for Economic Development, Metropolitan & Micropolitan Statistical Areas, Thematic, accessed July 15, 2023, https://ced.ky.gov/Webfiles/Docs/Maps/Metro_Stat_Area9.pdf; U.S. Census Bureau, Population Division, Kentucky: 2020 Core Based Statistical Areas and Counties, 2020, Thematic, 1:2696170, access July 15, 2023, https://www2.census.gov/programs-surveys/metro-micro/reference-maps/2020/state-maps/21_Kentucky_2020.pdf.
- ^ U.S. Board on Geographic Names, “Staged Products Directory: DomesticNames_KY_Text,” U.S. Geological Survey (U.S. Department of the Interior, June 1, 2023), accessed July 16, 2023, https://www.usgs.gov/us-board-on-geographic-names/download-gnis-data.
- ^ "Annual Estimates of the Resident Population for Counties: April 1, 2020 to July 1, 2023". United States Census Bureau. Retrieved March 14, 2024.
- ^ "U.S. Decennial Census". United States Census Bureau. Retrieved August 11, 2014.
- ^ "Historical Census Browser". University of Virginia Library. Retrieved August 11, 2014.
- ^ "Population of Counties by Decennial Census: 1900 to 1990". United States Census Bureau. Retrieved August 11, 2014.
- ^ "Census 2000 PHC-T-4. Ranking Tables for Counties: 1990 and 2000" (PDF). United States Census Bureau. Archived (PDF) from the original on March 27, 2010. Retrieved August 11, 2014.
- ^ "State & County QuickFacts". United States Census Bureau. Retrieved August 28, 2022.
- ^ U.S. Census Bureau, “Anderson County, Kentucky (V2022),” QuickFacts, July 1, 2022, https://www.census.gov/quickfacts/fact/table/andersoncountykentucky/PST045222. Accessed July 10, 2023.
- ^ "Commonwealth of Kentucky - State Board of Elections Voter Registration Statistics Report" (PDF). Archived (PDF) from the original on September 21, 2021. Retrieved September 21, 2021.
- ^ Leip, David. "Dave Leip's Atlas of U.S. Presidential Elections". uselectionatlas.org. Retrieved June 29, 2018.
Municipalities and communities of Anderson County, Kentucky, United States | ||
|---|---|---|
| City | 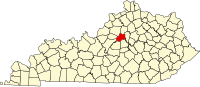 | |
| Unincorporated communities | ||
| Ghost town | ||
| ||
| International | |
|---|---|
| National | |
| Other | |