
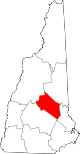
Belknap County, New Hampshire
Belknap County | |
|---|---|
 Laconia District Court on Academy Square in Laconia | |
|
UTC−4 (EDT) | |
| Congressional districts | 1st, 2nd |
| Website | www |
Belknap County (
The southwestern half of
History
Belknap County was organized in 1840 by removing parts of northeastern Merrimack County and northwestern Strafford County.[3] It is named for Dr. Jeremy Belknap, a renowned preacher, historian, and author of The History of New Hampshire. The first County Court was held within the town of Meredith, at a village known as Meredith Bridge on the Winnipesaukee River. In 1855, the town of Laconia was separated from Meredith.
Geography
According to the
Adjacent counties
- Carroll County (north)
- Strafford County (east)
- Merrimack County (southwest)
- Grafton County (northwest)
Demographics
| Census | Pop. | Note | %± |
|---|---|---|---|
| 1850 | 17,721 | — | |
| 1860 | 18,549 | 4.7% | |
| 1870 | 17,681 | −4.7% | |
| 1880 | 17,948 | 1.5% | |
| 1890 | 20,321 | 13.2% | |
| 1900 | 19,526 | −3.9% | |
| 1910 | 21,309 | 9.1% | |
| 1920 | 21,178 | −0.6% | |
| 1930 | 22,623 | 6.8% | |
| 1940 | 24,328 | 7.5% | |
| 1950 | 26,632 | 9.5% | |
| 1960 | 28,912 | 8.6% | |
| 1970 | 32,367 | 12.0% | |
| 1980 | 42,884 | 32.5% | |
| 1990 | 49,216 | 14.8% | |
| 2000 | 56,325 | 14.4% | |
| 2010 | 60,088 | 6.7% | |
| 2020 | 63,705 | 6.0% | |
| U.S. Decennial Census[1][5] 1790-1960[6] 1900-1990[7] 1990-2000[8] | |||
2000 census
As of the
as their first language.There were 22,459 households, out of which 30.4% had children under the age of 18 living with them, 55.7% were married couples living together, 9.20% had a female householder with no husband present, and 3% were non-families. 24.40% of all households were made up of individuals, and 9.70% had someone living alone who was 65 years of age or older. The average household size was 2.45 and the average family size was 2.91.
In the county, the population was spread out, with 23.60% under the age of 18, 6.70% from 18 to 24, 28.10% from 25 to 44, 26.40% from 45 to 64, and 15.10% who were 65 years of age or older. The median age was 40 years. For every 100 females, there were 97.10 males. For every 100 females age 18 and over, there were 95.10 males.
The median income for a household in the county was $43,605, and the median income for a family was $50,510. Males had a median income of $34,741 versus $25,445 for females. The
2010 census
As of the
Of the 24,766 households, 28.5% had children under the age of 18 living with them, 52.5% were married couples living together, 9.8% had a female householder with no husband present, 32.9% were non-families, and 25.7% of all households were made up of individuals. The average household size was 2.39 and the average family size was 2.84. The median age was 44.7 years.[10]
The median income for a household in the county was $54,929 and the median income for a family was $64,875. Males had a median income of $46,378 versus $34,690 for females. The per capita income for the county was $28,517. About 5.2% of families and 8.6% of the population were below the
Politics and government
Belknap County has become the most Republican county in New Hampshire: the Republican Party is the majority political party in the county, holding 15 of 18 seats in the General Court as of January 2021. Since 1888, only three Democrats have won Belknap County: Woodrow Wilson in 1912 when the Republican Party was mortally divided between William Howard Taft and Theodore Roosevelt; 1964, when Lyndon B. Johnson swept the Northeast due to Republican Barry Goldwater's conservative views regarding the Civil Rights Movement; and 2008, when Barack Obama swept every county in New England bar one. In 2020, Senator Jeanne Shaheen became the first Democrat to win Belknap County in a Senate race in over 50 years.[14]
| Year | Republican | Democratic | Third party | |||
|---|---|---|---|---|---|---|
| No. | % | No. | % | No. | % | |
| 2020 | 20,899 | 54.31% | 16,894 | 43.90% | 686 | 1.78% |
| 2016 | 19,315 | 55.11% | 13,517 | 38.57% | 2,213 | 6.31% |
| 2012 | 17,571 | 51.85% | 15,890 | 46.89% | 426 | 1.26% |
| 2008 | 16,402 | 48.80% | 16,796 | 49.97% | 416 | 1.24% |
| 2004 | 17,920 | 55.48% | 14,080 | 43.59% | 298 | 0.92% |
| 2000 | 14,799 | 55.23% | 10,719 | 40.00% | 1,277 | 4.77% |
| 1996 | 10,685 | 45.24% | 10,345 | 43.81% | 2,586 | 10.95% |
| 1992 | 10,578 | 42.16% | 8,405 | 33.50% | 6,107 | 24.34% |
| 1988 | 14,454 | 67.92% | 6,603 | 31.03% | 223 | 1.05% |
| 1984 | 14,200 | 74.63% | 4,743 | 24.93% | 84 | 0.44% |
| 1980 | 12,077 | 65.12% | 4,365 | 23.54% | 2,104 | 11.34% |
| 1976 | 9,876 | 60.78% | 6,143 | 37.81% | 230 | 1.42% |
| 1972 | 11,536 | 70.72% | 4,610 | 28.26% | 166 | 1.02% |
| 1968 | 8,642 | 61.42% | 4,942 | 35.12% | 487 | 3.46% |
| 1964 | 5,908 | 42.41% | 8,024 | 57.59% | 0 | 0.00% |
| 1960 | 9,156 | 61.92% | 5,630 | 38.08% | 0 | 0.00% |
| 1956 | 9,902 | 75.95% | 3,131 | 24.01% | 5 | 0.04% |
| 1952 | 9,567 | 71.81% | 3,755 | 28.19% | 0 | 0.00% |
| 1948 | 7,152 | 64.79% | 3,822 | 34.62% | 65 | 0.59% |
| 1944 | 6,188 | 53.74% | 5,325 | 46.24% | 2 | 0.02% |
| 1940 | 6,115 | 51.96% | 5,653 | 48.04% | 0 | 0.00% |
| 1936 | 6,219 | 53.98% | 5,150 | 44.70% | 153 | 1.33% |
| 1932 | 6,048 | 55.04% | 4,911 | 44.69% | 29 | 0.26% |
| 1928 | 6,762 | 64.63% | 3,689 | 35.26% | 11 | 0.11% |
| 1924 | 5,996 | 63.79% | 3,217 | 34.23% | 186 | 1.98% |
| 1920 | 5,628 | 61.74% | 3,464 | 38.00% | 23 | 0.25% |
| 1916 | 2,579 | 51.57% | 2,310 | 46.19% | 112 | 2.24% |
| 1912 | 1,741 | 36.82% | 1,862 | 39.38% | 1,125 | 23.79% |
| 1908 | 2,916 | 61.07% | 1,692 | 35.43% | 167 | 3.50% |
| 1904 | 2,867 | 60.31% | 1,761 | 37.04% | 126 | 2.65% |
| 1900 | 3,099 | 61.32% | 1,819 | 35.99% | 136 | 2.69% |
| 1896 | 3,465 | 72.67% | 978 | 20.51% | 325 | 6.82% |
| 1892 | 2,663 | 50.56% | 2,472 | 46.93% | 132 | 2.51% |
| 1888 | 2,687 | 50.35% | 2,537 | 47.54% | 113 | 2.12% |
| 1884 | 2,368 | 48.57% | 2,381 | 48.84% | 126 | 2.58% |
| 1880 | 2,350 | 47.81% | 2,483 | 50.52% | 82 | 1.67% |
| 1876 | 2,028 | 46.71% | 2,308 | 53.16% | 6 | 0.14% |
County Commission
The executive power of Belknap County's government is held by three county commissioners, each representing one of the three commissioner districts within the county.
| District | Commissioner | Hometown | Party |
|---|---|---|---|
| 1 | Peter Spanos (chair) | Winnisquam | Republican |
| 2 | Glen Waring (Vice Chair) | Gilmanton | Republican |
| 3 | Stephen Hodges (Clerk) | Gilford | Republican |
In addition to the County Commission, there are five directly elected officials: they include County Attorney, Register of Deeds, County Sheriff, Register of Probate, and County Treasurer.[16]
| Office | Name |
|---|---|
| County Attorney | Andrew Livernois (R) |
| Register of Deeds | Judith McGrath (R) |
| County Sheriff | William Wright (R) |
| Register of Probate | Alan Glassman (R) |
| County Treasurer | Michael Muzzey (R) |
General court
The legislative branch of Belknap County is made up of all of the members of the New Hampshire House of Representatives from the county. In total, there are 18 members from nine different districts. After the 2022 elections, the party distribution and representatives were as follows.
| Affiliation | Members | Voting share | |
|---|---|---|---|
| Democratic Party | 3 | 16.7% | |
| Republican Party | 15 | 83.3% | |
| Total | 18 | 100% | |
Communities
There are ten towns and one city in Belknap County.
City
- Laconia (county seat)
Towns
Census-designated places
Villages
See also
- National Register of Historic Places listings in Belknap County, New Hampshire
- Rosenblatt v. Baer, a 1966 United States Supreme Court case involving an employee of Belknap County
References
- ^ a b "Belknap County, New Hampshire: 2020 DEC Redistricting Data (PL 94-171)". U.S. Census Bureau. Retrieved October 28, 2021.
- ^ "Find a County". National Association of Counties. Archived from the original on July 4, 2012. Retrieved June 7, 2011.
- ^ "COUNTY LIST - New Hampshire Genealogy and History AT SEARCHROOTS". searchroots.com. Archived from the original on July 16, 2011. Retrieved September 15, 2008.
- ^ "2010 Census Gazetteer Files". United States Census Bureau. August 22, 2012. Archived from the original on December 27, 2014. Retrieved December 27, 2014.
- ^ "U.S. Decennial Census". United States Census Bureau. Retrieved December 27, 2014.
- ^ "Historical Census Browser". University of Virginia Library. Retrieved December 27, 2014.
- ^ "Population of Counties by Decennial Census: 1900 to 1990". United States Census Bureau. Retrieved December 27, 2014.
- ^ "Census 2000 PHC-T-4. Ranking Tables for Counties: 1990 and 2000" (PDF). United States Census Bureau. Archived (PDF) from the original on March 27, 2010. Retrieved December 27, 2014.
- ^ "U.S. Census website". United States Census Bureau. Retrieved January 31, 2008.
- ^ a b c "DP-1 Profile of General Population and Housing Characteristics: 2010 Demographic Profile Data". United States Census Bureau. Archived from the original on February 13, 2020. Retrieved January 12, 2016.
- ^ "Population, Housing Units, Area, and Density: 2010 - County". United States Census Bureau. Archived from the original on February 13, 2020. Retrieved January 12, 2016.
- ^ "DP02 SELECTED SOCIAL CHARACTERISTICS IN THE UNITED STATES – 2006-2010 American Community Survey 5-Year Estimates". United States Census Bureau. Archived from the original on February 13, 2020. Retrieved January 12, 2016.
- ^ "DP03 SELECTED ECONOMIC CHARACTERISTICS – 2006-2010 American Community Survey 5-Year Estimates". United States Census Bureau. Archived from the original on February 13, 2020. Retrieved January 12, 2016.
- ^ David Leip. "Dave Leip's Atlas of U.S. Presidential Elections". uselectionatlas.org.
- ^ Leip, David. "Dave Leip's Atlas of U.S. Presidential Elections". uselectionatlas.org. Retrieved April 5, 2018.
- ^ "Belknap County". Archived from the original on August 7, 2018. Retrieved August 7, 2018.
- ^ "General Election Winners - 11/03/2020" (PDF). New Hampshire Secretary of State's Office. November 11, 2020. Archived (PDF) from the original on May 25, 2021. Retrieved December 8, 2020.
External links
Places adjacent to Belknap County, New Hampshire | ||||||||||||||||
|---|---|---|---|---|---|---|---|---|---|---|---|---|---|---|---|---|
| ||||||||||||||||
 | ||||
| Towns | ||||
| CDPs | ||||
Other villages | ||||
| Footnotes | ‡This populated place also has portions in an adjacent county or counties | |||
| ||||
| International | |
|---|---|
| National | |
| Geographic | |