
Portal:Geodesy
The Geodesy Portal

GPS Block II-F satellite in Earth orbit
astronomical bodies, such as planets or circumplanetary systems.
control networks, applying space geodesy and terrestrial geodetic techniques, and relying on datums and coordinate systems. The job titles are geodesist and geodetic surveyor. (Full article...
)
Selected images
-
 A map of recent volcanic activity and ridge spreading. The areas where NASA GRACE measured gravity to be stronger than the theoretical gravity have a strong correlation with the positions of the volcanic activity and ridge spreading. (from Gravity of Earth)
 -
 Mapping can be done withGPS and laser rangefinder directly in the field. Image shows mapping of forest structure (position of trees, dead wood and canopy). (from Cartography)
 -
 Illustrated map (from Cartography)
 -
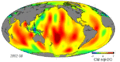
 Earth's gravity measured by NASAGRACE mission, showing deviations from the theoretical gravity of an idealized, smooth Earth, the so-called Earth ellipsoid. Red shows the areas where gravity is stronger than the smooth, standard value, and blue reveals areas where gravity is weaker (Animated version). (from Gravity of Earth)
 -

-
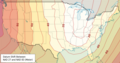 Datum shift betweenNAD83, in metres (from Geodesy)
 -
-
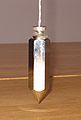
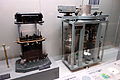 Gravity measurement devices, pendulum (left) and absolute gravimeter (right) (from Geodesy)
 -
 A 14th-centuryPrime Meridian at the Fortunate Isles. (from Cartography)
 -
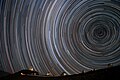 Starry circles arc around the south celestial pole, seen overhead atESO's La Silla Observatory. (from Earth's rotation)
 -
 Areal distortion caused by Mercator projection (from Cartography)
 -
 Global plate tectonic movement using GPS (from Geodesy)
 -
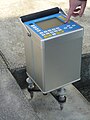
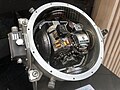
 A modern instrument for geodeticsatellites (from Geodesy)
 -
 The Bedolina Map and its tracing, 6th–4th century BCE (from Cartography)
 -
 On aprograde planet like Earth, the stellar day is shorter than the solar day. At time 1, the Sun and a certain distant star are both overhead. At time 2, the planet has rotated 360 degrees and the distant star is overhead again but the Sun is not (1→2 = one stellar day). It is not until a little later, at time 3, that the Sun is overhead again (1→3 = one solar day). (from Earth's rotation)
 -
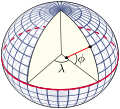 The definition of latitude (φ) and longitude (λ) on an ellipsoid of revolution (or spheroid). The graticule spacing is 10 degrees. The latitude is defined as the angle between the normal to the ellipsoid and the equatorial plane. (from Geodesy)
 -
 Equatorial (a), polar (b) and mean Earth radii as defined in the 1984 World Geodetic System (from Geodesy)
 -

-
 How very-long-baseline interferometry (VLBI) works (from Geodesy)
 -
 A simulated history of Earth's day length, depicting a resonant-stabilizing event throughout the Precambrian era (from Earth's rotation)
 -
 2D grid for elliptical coordinates (from Geodesy)
 -
 Copy (1472) ofTO map of the world. (from Cartography)
 -
 Surveyor using a total station (from Geomatics)
 -
 Thislong-exposure photo of the northern night sky above the Nepali Himalayas shows the apparent paths of the stars as Earth rotates. (from Earth's rotation)
 -

-
 Plot of latitude versus tangential speed. The dashed line shows thecruise speed. (from Earth's rotation)
 -
 Relief map Sierra Nevada (from Cartography)
 -
 A pre-Mercator nautical chart of 1571, from Portuguese cartographer Fernão Vaz Dourado (c. 1520 – c. 1580). It belongs to the so-called plane chart model, where observed latitudes and magnetic directions are plotted directly into the plane, with a constant scale, as if the Earth were a plane (Portuguese National Archives of Torre do Tombo, Lisbon). (from Cartography)
 -
 A relative gravimeter (from Geodesy)
 -

-
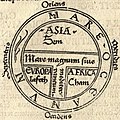
 A medieval depiction of the Ecumene (1482, Johannes Schnitzer, engraver), constructed after the coordinates in Ptolemy's Geography and using his second map projection. The translation into Latin and dissemination of Geography in Europe, in the beginning of the 15th century, marked the rebirth of scientific cartography, after more than a millennium of stagnation. (from Cartography)
 -

-
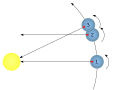
 Visual fix by three bearings plotted on a nautical chart (from Geopositioning)
 -
 Valcamonica rock art (I), Paspardo r. 29, topographic composition, 4th millennium BCE (from Cartography)
 -
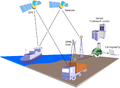 Principles of geolocation using GPS (from Geopositioning)
 -
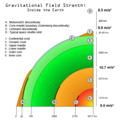 Gravity at different internal layers of Earth (1 = continental crust, 2 = oceanic crust, 3 = upper mantle, 4 = lower mantle, 5+6 = core, A = crust-mantle boundary) (from Gravity of Earth)
 -
Earth's axial tilt is about 23.4°. It oscillates between 22.1° and 24.5° on a 41,000-year cycle and is currently decreasing. (from Earth's rotation)
-
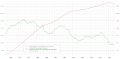 Deviation of day length from SI-based day (from Earth's rotation)
 -
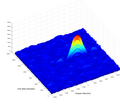
 Geoid, an approximation for the shape of the Earth; shown here with vertical exaggeration (10000 vertical scaling factor). (from Geodesy)
 -
 Small section of an orienteering map (from Cartography)
 -
 A plumb bob determines the local vertical direction (from Gravity of Earth)
 -
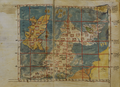
 Topographic map of Easter Island (from Cartography)
 -
 An artist's rendering of the protoplanetary disk (from Earth's rotation)
 -
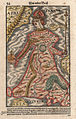
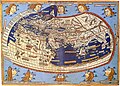
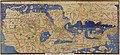 The Tabula Rogeriana, drawn by Muhammad al-Idrisi for Roger II of Sicily in 1154. South is at the top. (from Cartography)
 -
 Global gravity anomaly animation over oceans from the NASA's GRACE (Gravity Recovery and Climate Experiment) (from Geodesy)
 -
 Earth's rotation imaged by Deep Space Climate Observatory, showing axis tilt (from Earth's rotation)
 -
 Navigation device, Apollo program (from Geodesy)
 -
 The cartographic process (from Cartography)
 -
 Height measurement using satellite altimetry (from Geodesy)
 -
 Geodetic control mark (from Geodesy)
 -
 Initial acquisition of GPS signal in 2D (from Geodesy)


_and_absolute_(right)_-_National_Museum_of_Nature_and_Science,_Tokyo_-_DSC07808.JPG)


.svg)


.jpg)


.jpeg)


Subcategories

- Select [►] to view subcategories
Subtopics
| Overview | |
|---|---|
| Subfields | |
| Physical phenomena | |
| Related disciplines | |
Related portals
Associated Wikimedia
The following Wikimedia Foundation sister projects provide more on this subject:
-
 Commons
Free media repository -
 Wikibooks
Free textbooks and manuals -
 Wikidata
Free knowledge base -
 Wikinews
Free-content news -
 Wikiquote
Collection of quotations -
 Wikisource
Free-content library -
 Wikiversity
Free learning tools -
 Wiktionary
Dictionary and thesaurus
Discover Wikipedia using portals


