East Antarctic Ice Sheet
| East Antarctic ice sheet | |
|---|---|
 | |
| Type | Ice sheet |
| Thickness | ~2.2 km (1.4 mi) (average),[1] ~4.9 km (3.0 mi) (maximum) [2] |
The East Antarctic Ice Sheet (EAIS) lies between
The surface of the EAIS is the driest, windiest, and coldest place on Earth. Lack of moisture in the air, high albedo from the snow as well as the surface's consistently high elevation[4] results in the reported cold temperature records of nearly −100 °C (−148 °F).[5][6] It is the only place on Earth cold enough for atmospheric temperature inversion to occur consistently. That is, while the atmosphere is typically warmest near the surface and becomes cooler at greater elevation, atmosphere during the Antarctic winter is cooler at the surface than in its middle layers. Consequently, greenhouse gases actually trap heat in the middle atmosphere and reduce its flow towards the surface while the temperature inversion lasts.[4]
Due to these factors, East Antarctica had experienced slight cooling for decades while the rest of the world warmed as the result of climate change. Clear warming over East Antarctica only started to occur since the year 2000, and was not conclusively detected until the 2020s.[7][8] In the early 2000s, cooling over East Antarctica seemingly outweighing warming over the rest of the continent was frequently misinterpreted by the media and occasionally used as an argument for climate change denial.[9][10][11] After 2009, improvements in Antarctica's instrumental temperature record have proven that the warming over West Antarctica resulted in consistent net warming across the continent since the 1957.[12]
Because the East Antarctic ice sheet has barely warmed, it is still gaining ice on average.
Description

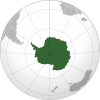
East Antarctic Ice Sheet is located directly above the East Antarctic Shield – a craton (stable area of the Earth's crust) with the area of 10,200,000 km2 (3,900,000 sq mi), which accounts for around 73% of the entire Antarctic landmass.[19] East Antarctica is separate from West Antarctica due to the presence of Transantarctic Mountains, which span nearly 3,500 km (2,200 mi) from the Weddell Sea to the Ross Sea, and have a width of 100–300 km (62–186 mi).[1]
The ice sheet has an average thickness of around 2.2 km (1.4 mi). The thickest ice in Antarctica is located near

These high elevations are an important reason for why the ice sheet is the driest, windiest, and coldest place on Earth. Dome A in particular sets reported cold temperature records of nearly −100 °C (−148 °F).
Many countries have made
Geologic history
While relatively small
Afterwards, the East Antarctic Ice Sheet declined substantially during the
Recent climate change

Antarctica as a whole has low sensitivity to climate change because it is surrounded by the Southern Ocean, which is more effective at absorbing heat than any other ocean due to the currents of the Southern Ocean overturning circulation,[33][34] very low amounts of water vapor (which conducts heat through the atmosphere)[32] and because of the high albedo (reflectivity) of its icy surface and of the surrounding sea ice.[4] These factors make Antarctica the coldest continent, and East Antarctica is additionally cooler than the West Antarctica, because it is located at a substantially greater elevation.[4] Thus, it is the only place on Earth cold enough for atmospheric temperature inversion to occur every winter.[32] While the atmosphere on Earth is at its warmest near the surface and becomes cooler as elevation increases, temperature inversion during the Antarctic winter results in middle layers of the atmosphere being warmer than the surface.[32]
This leads to the negative greenhouse effect on a local scale, where greenhouse gases trap heat in the middle atmosphere and reduce its flow towards the surface and towards space, while normally, they prevent the flow of heat from the lower atmosphere and towards space.[32] This effect lasts until the end of the Antarctic winter.[4] Consequently, East Antarctica had experienced cooling in the 1980s and 1990s, even as the rest of the Earth was warming. For instance, between 1986 and 2006 there had been a cooling of 0.7 °C (1.3 °F) per decade at Lake Hoare station in the McMurdo Dry Valleys.[35] A 2002 paper by Peter Doran suggested that the cooling over East Antarctica outweighed warming of the rest of the continent.[36] While the paper estimated that about 42% of the Antarctic area had been warming, it was wrongly described by many media outlets as a proof that there was no warming in Antarctica.[9] In 2004, author Michael Crichton used that cooling as one of his arguments for denying climate change in his novel State of Fear.[37] First other scientists, and then Peter Doran himself eventually had to debunk the book's claims.[10][11]

In 2009, it was demonstrated that the West Antarctic Ice Sheet has warmed by more than 0.1 °C/decade since the 1950s, resulting in a

The limited warming and already low temperatures over East Antarctica mean that as of early 2020s, the majority of observational evidence shows it continuing to gain mass.[15][39][13][14] Some analyses have suggested it already began to lose mass in 2000s,[40][41] but they over-extrapolated some observed losses onto the poorly-observed areas, and a more complete observational record shows continued mass gain.[13] Because it is currently gaining mass, East Antarctic Ice Sheet is not expected to play a role in the 21st century sea level rise. However, it is still subject to adverse change, such as the retreat of Denman Glacier,[38][42] or the flow of warmer ocean current into ice cavities beneath the stabilizing ice shelves like the Fimbulisen ice shelf in the Queen Maud Land.[43]
Long-term future

If global warming were to reach higher levels, then the EAIS would play an increasingly larger role in sea level rise occurring after 2100. According to the most recent reports of the
Sustained ice loss from the EAIS would begin with the significant erosion of the so-called subglacial basins, such as
The entire East Antarctic Ice Sheet holds enough ice to raise global sea levels by 53.3 m (175 ft).
If the entire ice sheet were to disappear, then the change in
See also
- Cryosphere
- West Antarctic ice sheet
- Greenland ice sheet
- Climate change in Antarctica
References
- ^ ISBN 978-0-309-11854-5.
- ^ ISSN 1994-0424.
- ^ .
- ^ S2CID 222179485.
- ^ hdl:1874/367883.
- ^ a b Vizcarra, Natasha (25 June 2018). "New study explains Antarctica's coldest temperatures". National Snow and Ice Data Center. Retrieved 10 January 2024.
- ^ .
- ^ .
- ^ a b Davidson, Keay (2002-02-04). "Media goofed on Antarctic data / Global warming interpretation irks scientists". San Francisco Chronicle. Retrieved 2013-04-13.
- ^ Real Climate. Retrieved 2008-08-14.
At first glance this seems to contradict the idea of "global" warming, but one needs to be careful before jumping to this conclusion. A rise in the global mean temperature does not imply universal warming. Dynamical effects (changes in the winds and ocean circulation) can have just as large an impact, locally as the radiative forcing from greenhouse gases. The temperature change in any particular region will in fact be a combination of radiation-related changes (through greenhouse gases, aerosols, ozone and the like) and dynamical effects. Since the winds tend to only move heat from one place to another, their impact will tend to cancel out in the global mean.
- ^ a b Peter Doran (2006-07-27). "Cold, Hard Facts". The New York Times. Archived from the original on April 11, 2009. Retrieved 2008-08-14.
- ^ S2CID 4410477.
- ^ .
Although their methods of interpolation or extrapolation for areas with unobserved output velocities have an insufficient description for the evaluation of associated errors, such errors in previous results (Rignot and others, 2008) caused large overestimates of the mass losses as detailed in Zwally and Giovinetto (Zwally and Giovinetto, 2011).
- ^ a b NASA (7 July 2023). "Antarctic Ice Mass Loss 2002–2023".
- ^ S2CID 4414976.
- ^ S2CID 252161375.
- ^ a b c d e f Armstrong McKay, David (9 September 2022). "Exceeding 1.5°C global warming could trigger multiple climate tipping points – paper explainer". climatetippingpoints.info. Retrieved 2 October 2022.
- ^ .
- .
- Earth Magazine. Retrieved 15 January 2024.
- ^ Robin Bell (12 November 2008). "Dispatches from the Bottom of the Earth: An Antarctic Expedition in Search of Large Mountains Encased in Ice". Scientific American. Retrieved 15 January 2024.
- ^ a b Davies, Bethan (22 June 2020). "East Antarctic Ice Sheet". AntarcticGlaciers.org.
- ISBN 978-0-379-20321-9.
- ^ ISSN 2041-1723.
- S2CID 49185845.
- .
- ^ Voosen, Paul (2018-12-18). "Discovery of recent Antarctic ice sheet collapse raises fears of a new global flood". Science. Retrieved 2018-12-28.
- PMID 32047039.
- ^ Carlson, Anders E; Walczak, Maureen H; Beard, Brian L; Laffin, Matthew K; Stoner, Joseph S; Hatfield, Robert G (10 December 2018). Absence of the West Antarctic ice sheet during the last interglaciation. American Geophysical Union Fall Meeting.
- .
- ^ AHMED, Issam. "Antarctic octopus DNA reveals ice sheet collapse closer than thought". phys.org. Retrieved 2023-12-23.
- ^ PMC 7580794.
- PMID 35039511.
- ^ Lenton, T. M.; Armstrong McKay, D.I.; Loriani, S.; Abrams, J.F.; Lade, S.J.; Donges, J.F.; Milkoreit, M.; Powell, T.; Smith, S.R.; Zimm, C.; Buxton, J.E.; Daube, Bruce C.; Krummel, Paul B.; Loh, Zoë; Luijkx, Ingrid T. (2023). The Global Tipping Points Report 2023 (Report). University of Exeter.
- S2CID 219738421.
- S2CID 387284. Archived from the original(PDF) on 11 December 2004.
- ISBN 978-0-06-621413-9.huge icebergs. That's what gets reported year after year. But the continent as a whole is getting colder, and the ice is getting thicker. First Edition
The data show that one relatively small area called the Antarctic Peninsula is melting and calving
- ^ ISSN 0094-8276.
- S2CID 49188002.
- S2CID 130927366.
- PMID 30642972.
- ^ Amos, Jonathan (2020-03-23). "Climate change: Earth's deepest ice canyon vulnerable to melting". BBC.
- ^ Lauber, Julius; Hattermann, Torr; de Steur, Laura; Darelius, Elin; Auger, Matthis; Anders Nost, Ole; Moholdt, Geir (21 September 2023). "Warming beneath an East Antarctic ice shelf due to increased subpolar westerlies and reduced sea ice". Nature Geoscience. 16: 877–885.
- ^ a b "Anticipating Future Sea Levels". EarthObservatory.NASA.gov. National Aeronautics and Space Administration (NASA). 2021. Archived from the original on 7 July 2021.
- ^ a b Fox-Kemper, B.; Hewitt, H.T.; Xiao, C.; Aðalgeirsdóttir, G.; Drijfhout, S.S.; Edwards, T.L.; Golledge, N.R.; Hemer, M.; Kopp, R.E.; Krinner, G.; Mix, A. (2021). Masson-Delmotte, V.; Zhai, P.; Pirani, A.; Connors, S.L.; Péan, C.; Berger, S.; Caud, N.; Chen, Y.; Goldfarb, L. (eds.). "Chapter 9: Ocean, Cryosphere and Sea Level Change" (PDF). Climate Change 2021: The Physical Science Basis. Contribution of Working Group I to the Sixth Assessment Report of the Intergovernmental Panel on Climate Change. Cambridge University Press, Cambridge, UK and New York, NY, USA: 1270–1272.
- ^ hdl:10278/5003813.
- S2CID 221885420.