
Shelby County, Illinois
Shelby County | |
|---|---|
UTC−5 (CDT) | |
| Congressional district | 15th |
| Website | www |
Shelby County is a
History
Shelby County was established in 1827 out of Fayette County. It was named in honor of Isaac Shelby, governor of Kentucky and participant in the American Revolutionary War.
-
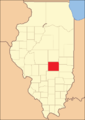
![Shelby county from the time of its creation to 1829, including a large tract of unorganized territory temporarily attached to it, whose precise border was not defined.[3]](//upload.wikimedia.org/wikipedia/commons/thumb/2/28/Shelby_County_Illinois_1827.png/85px-Shelby_County_Illinois_1827.png) Shelby county from the time of its creation to 1829, including a large tract of unorganized territory temporarily attached to it, whose precise border was not defined.[3]
Shelby county from the time of its creation to 1829, including a large tract of unorganized territory temporarily attached to it, whose precise border was not defined.[3] -
 Shelby County between 1829 and 1839
 -
 Shelby County between 1839 and 1843
 -
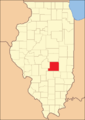
 Shelby County in 1843, reduced to its present borders
![Shelby county from the time of its creation to 1829, including a large tract of unorganized territory temporarily attached to it, whose precise border was not defined.[3]](/File:Shelby_County_Illinois_1827.png)


Geography
According to the
Climate and weather
| Shelbyville, Illinois | ||||||||||||||||||||||||||||||||||||||||||||||||||||||||||||
|---|---|---|---|---|---|---|---|---|---|---|---|---|---|---|---|---|---|---|---|---|---|---|---|---|---|---|---|---|---|---|---|---|---|---|---|---|---|---|---|---|---|---|---|---|---|---|---|---|---|---|---|---|---|---|---|---|---|---|---|---|
| Climate chart (explanation) | ||||||||||||||||||||||||||||||||||||||||||||||||||||||||||||
| ||||||||||||||||||||||||||||||||||||||||||||||||||||||||||||
| ||||||||||||||||||||||||||||||||||||||||||||||||||||||||||||
In recent years, average temperatures in the county seat of Shelbyville have ranged from a low of 19 °F (−7 °C) in January to a high of 87 °F (31 °C) in July, although a record low of −26 °F (−32 °C) was recorded in January 1915 and a record high of 111 °F (44 °C) was recorded in July 1936. Average monthly precipitation ranged from 1.89 inches (48 mm) in February to 4.05 inches (103 mm) in June.[5]
Major highways
 Interstate 57
- U.S. Highway 45
- U.S. Highway 51
 Illinois Route 16
 Illinois Route 32
 Illinois Route 128
Adjacent counties
- Macon County - north
- Moultrie County - northeast
- Coles County - east
- Cumberland County - east
- Effingham County - south
- Fayette County - south
- Montgomery County - southwest
- Christian County - west
Demographics
| Census | Pop. | Note | %± |
|---|---|---|---|
| 1830 | 2,972 | — | |
| 1840 | 6,659 | 124.1% | |
| 1850 | 7,807 | 17.2% | |
| 1860 | 14,613 | 87.2% | |
| 1870 | 25,476 | 74.3% | |
| 1880 | 30,270 | 18.8% | |
| 1890 | 31,191 | 3.0% | |
| 1900 | 32,126 | 3.0% | |
| 1910 | 31,693 | −1.3% | |
| 1920 | 29,601 | −6.6% | |
| 1930 | 25,471 | −14.0% | |
| 1940 | 26,290 | 3.2% | |
| 1950 | 24,434 | −7.1% | |
| 1960 | 23,404 | −4.2% | |
| 1970 | 22,589 | −3.5% | |
| 1980 | 23,923 | 5.9% | |
| 1990 | 22,261 | −6.9% | |
| 2000 | 22,893 | 2.8% | |
| 2010 | 22,363 | −2.3% | |
| 2020 | 20,990 | −6.1% | |
| 2023 (est.) | 20,568 | [6] | −2.0% |
| U.S. Decennial Census[7] 1790-1960[8] 1900-1990[9] 1990-2000[10] 2010-2013[1] | |||
As of the
Of the 9,216 households, 29.2% had children under the age of 18 living with them, 57.1% were married couples living together, 8.0% had a female householder with no husband present, 30.8% were non-families, and 27.1% of all households were made up of individuals. The average household size was 2.40 and the average family size was 2.90. The median age was 43.5 years.[11]
The median income for a household in the county was $44,627 and the median income for a family was $55,655. Males had a median income of $40,119 versus $27,860 for females. The per capita income for the county was $21,891. About 7.8% of families and 11.3% of the population were below the
Census-designated place
The Census Bureau has defined one census-designated place (CDP) in Shelby County.
Government
Townships
Shelby County is divided into these townships:
Communities
Cities
- Shelbyville (seat)
- Windsor
Town
Villages
Other unincorporated communities
Politics
| Year | Republican | Democratic | Third party | |||
|---|---|---|---|---|---|---|
| No. | % | No. | % | No. | % | |
| 2020 | 9,426 | 77.80% | 2,504 | 20.67% | 185 | 1.53% |
| 2016 | 8,229 | 74.48% | 2,288 | 20.71% | 532 | 4.81% |
| 2012 | 6,843 | 65.55% | 3,342 | 32.01% | 254 | 2.43% |
| 2008 | 6,396 | 58.67% | 4,245 | 38.94% | 261 | 2.39% |
| 2004 | 6,753 | 63.85% | 3,744 | 35.40% | 80 | 0.76% |
| 2000 | 5,851 | 57.57% | 4,018 | 39.54% | 294 | 2.89% |
| 1996 | 4,215 | 43.06% | 4,249 | 43.41% | 1,324 | 13.53% |
| 1992 | 3,631 | 32.49% | 5,101 | 45.65% | 2,443 | 21.86% |
| 1988 | 5,370 | 53.28% | 4,650 | 46.14% | 58 | 0.58% |
| 1984 | 6,372 | 59.38% | 4,317 | 40.23% | 41 | 0.38% |
| 1980 | 6,441 | 59.12% | 3,988 | 36.61% | 465 | 4.27% |
| 1976 | 5,234 | 45.54% | 6,172 | 53.70% | 87 | 0.76% |
| 1972 | 7,217 | 62.08% | 4,389 | 37.75% | 20 | 0.17% |
| 1968 | 5,487 | 49.27% | 4,528 | 40.66% | 1,122 | 10.07% |
| 1964 | 4,281 | 37.66% | 7,088 | 62.34% | 0 | 0.00% |
| 1960 | 6,872 | 54.53% | 5,720 | 45.39% | 11 | 0.09% |
| 1956 | 7,075 | 56.94% | 5,337 | 42.95% | 13 | 0.10% |
| 1952 | 7,189 | 57.65% | 5,268 | 42.25% | 12 | 0.10% |
| 1948 | 5,282 | 47.89% | 5,589 | 50.68% | 158 | 1.43% |
| 1944 | 6,201 | 50.65% | 5,919 | 48.35% | 123 | 1.00% |
| 1940 | 7,250 | 47.71% | 7,704 | 50.69% | 243 | 1.60% |
| 1936 | 5,795 | 40.81% | 8,186 | 57.64% | 220 | 1.55% |
| 1932 | 4,657 | 35.91% | 8,093 | 62.40% | 219 | 1.69% |
| 1928 | 7,214 | 62.58% | 4,071 | 35.31% | 243 | 2.11% |
| 1924 | 5,605 | 48.13% | 5,265 | 45.21% | 776 | 6.66% |
| 1920 | 6,351 | 53.93% | 5,113 | 43.42% | 312 | 2.65% |
| 1916 | 5,911 | 42.61% | 7,515 | 54.18% | 445 | 3.21% |
| 1912 | 1,431 | 20.77% | 3,467 | 50.33% | 1,991 | 28.90% |
| 1908 | 3,312 | 42.30% | 4,065 | 51.92% | 453 | 5.79% |
| 1904 | 3,220 | 46.53% | 2,962 | 42.80% | 738 | 10.66% |
| 1900 | 3,365 | 41.38% | 4,514 | 55.52% | 252 | 3.10% |
| 1896 | 3,071 | 38.75% | 4,709 | 59.42% | 145 | 1.83% |
| 1892 | 2,304 | 32.45% | 3,523 | 49.62% | 1,273 | 17.93% |
See also
References
- ^ a b "State & County QuickFacts". United States Census Bureau. Retrieved July 8, 2014.
- ^ "Find a County". National Association of Counties. Retrieved June 7, 2011.
- ^ White, Jesse. Origin and Evolution of Illinois Counties. State of Illinois, March 2010. [1]
- ^ a b "Population, Housing Units, Area, and Density: 2010 - County". United States Census Bureau. Archived from the original on February 12, 2020. Retrieved July 12, 2015.
- ^ a b "Monthly Averages for Shelbyville, Illinois". The Weather Channel. Retrieved January 27, 2011.
- ^ "Annual Estimates of the Resident Population for Counties: April 1, 2020 to July 1, 2023". United States Census Bureau. Retrieved April 2, 2024.
- ^ "U.S. Decennial Census". United States Census Bureau. Retrieved July 8, 2014.
- ^ "Historical Census Browser". University of Virginia Library. Retrieved July 8, 2014.
- ^ "Population of Counties by Decennial Census: 1900 to 1990". United States Census Bureau. Retrieved July 8, 2014.
- ^ "Census 2000 PHC-T-4. Ranking Tables for Counties: 1990 and 2000" (PDF). United States Census Bureau. Retrieved July 8, 2014.
- ^ a b c "DP-1 Profile of General Population and Housing Characteristics: 2010 Demographic Profile Data". United States Census Bureau. Archived from the original on February 13, 2020. Retrieved July 12, 2015.
- ^ "DP02 SELECTED SOCIAL CHARACTERISTICS IN THE UNITED STATES – 2006-2010 American Community Survey 5-Year Estimates". United States Census Bureau. Archived from the original on February 13, 2020. Retrieved July 12, 2015.
- ^ "DP03 SELECTED ECONOMIC CHARACTERISTICS – 2006-2010 American Community Survey 5-Year Estimates". United States Census Bureau. Archived from the original on February 13, 2020. Retrieved July 12, 2015.
- ^ Leip, David. "Dave Leip's Atlas of U.S. Presidential Elections". uselectionatlas.org. Retrieved November 12, 2018.
Places adjacent to Shelby County, Illinois | ||||||||||||||||
|---|---|---|---|---|---|---|---|---|---|---|---|---|---|---|---|---|
| ||||||||||||||||
 | ||||
| Towns | ||||
Villages | ||||
| Townships | ||||
| CDPs | ||||
| Other communities | ||||
| Footnotes | ‡This populated place also has portions in an adjacent county or counties | |||
| ||||
| International | |
|---|---|
| National | |
| Geographic | |
| Other | |