
Clay County, Illinois
Clay County | |
|---|---|
UTC−5 (CDT) | |
| Congressional district | 12th |
| Website | claycountyillinois |
Clay County is a
In 1950, the
History
The future Clay County had been inhabited for thousands of years by the
Clay County was authorized by act of the state legislature on December 23, 1824, by partitioning portions of Wayne, Crawford, and Fayette counties.[4] It was named for American statesman Henry Clay,[5] a member of the United States Senate from Kentucky and United States Secretary of State. Clay was a candidate for president in 1824.
The first appointed commissioners met on March 8, 1825, to organize the county government. Land for county building purposes was donated near Habbardsville. The commissioners accepted the offer, renamed it Maysville, and had a two-room courthouse erected on the property by the end of the year.[6] The seat remained at that location (about a mile south of the present community of Clay City) through 1841, and in 1842 the county government began functioning in Louisville, being at the center of the county's area.[4]
The first railroad line through Clay County was laid between 1850 and 1854, the Ohio and Mississippi Line.[4] By 1855–56, the Illinois Central Railroad had also been constructed across the northwest corner of the county.
Geography
-
 Clay County from the time of its creation to 1831
 -
 Clay County between 1831 and 1841
 -
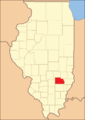
 Clay County was reduced to its current size in 1841 by the creation of Richland County.


The low rolling hills of Clay County are devoted to agricultural production. The various drainage areas are still largely wooded. The Little Wabash River flows southeastward through the center of the county, while Muddy Creek drains the eastern portion (the meanders of Little Muddy delineate a portion of the county's east border with Richland County). Buck Creek, in the south part of the county, flows eastward and joins the Little Wabash above Clay City. Raccoon Creek flows southeastward from the lower part of the county into Wayne County.[7] The highest point on the terrain (646 feet/197 meters ASL) is a small point along the western border with Marion County.[8]
The county produced excellent timber during the nineteenth century, and some sandstone and limestone. The soil is light and not considered adapted to farming on a large scale.[4]
According to the
Adjacent counties
- Effingham County - north
- Jasper County - northeast
- Richland County - east
- Wayne County - south
- Marion County - west
- Fayette County - northwest
Major highways
Protected areas
- Martin T Snyder Memorial Nature Preserve[10]
Cities
Villages
- Clay City
- Iola
- Louisville (seat)
- Sailor Springs
- Xenia
Unincorporated communities
Townships
Climate and weather
| Louisville, Illinois | ||||||||||||||||||||||||||||||||||||||||||||||||||||||||||||
|---|---|---|---|---|---|---|---|---|---|---|---|---|---|---|---|---|---|---|---|---|---|---|---|---|---|---|---|---|---|---|---|---|---|---|---|---|---|---|---|---|---|---|---|---|---|---|---|---|---|---|---|---|---|---|---|---|---|---|---|---|
| Climate chart (explanation) | ||||||||||||||||||||||||||||||||||||||||||||||||||||||||||||
| ||||||||||||||||||||||||||||||||||||||||||||||||||||||||||||
| ||||||||||||||||||||||||||||||||||||||||||||||||||||||||||||
In recent years, average temperatures in the county seat of Louisville have ranged from a low of 21 °F (−6 °C) in January to a high of 89 °F (32 °C) in July, although a record low of −25 °F (−32 °C) was recorded in January 1904 and a record high of 111 °F (44 °C) was recorded in July 1936. Average monthly precipitation ranged from 2.49 inches (63 mm) in February to 4.34 inches (110 mm) in June.[11]
Demographics
| Census | Pop. | Note | %± |
|---|---|---|---|
| 1830 | 755 | — | |
| 1840 | 3,228 | 327.5% | |
| 1850 | 4,289 | 32.9% | |
| 1860 | 9,336 | 117.7% | |
| 1870 | 15,875 | 70.0% | |
| 1880 | 16,192 | 2.0% | |
| 1890 | 16,772 | 3.6% | |
| 1900 | 19,553 | 16.6% | |
| 1910 | 18,661 | −4.6% | |
| 1920 | 17,684 | −5.2% | |
| 1930 | 16,155 | −8.6% | |
| 1940 | 18,947 | 17.3% | |
| 1950 | 17,445 | −7.9% | |
| 1960 | 15,815 | −9.3% | |
| 1970 | 14,735 | −6.8% | |
| 1980 | 15,283 | 3.7% | |
| 1990 | 14,460 | −5.4% | |
| 2000 | 14,560 | 0.7% | |
| 2010 | 13,815 | −5.1% | |
| 2020 | 13,288 | −3.8% | |
| 2023 (est.) | 12,999 | [12] | −2.2% |
| US Decennial Census[13] 1790-1960[14] 1900-1990[15] 1990-2000[16] 2010[17] | |||

2010 census
As of the
Of the 5,697 households, 29.5% had children under the age of 18 living with them, 52.1% were married couples living together, 9.4% had a female householder with no husband present, 33.5% were non-families, and 28.9% of all households were made up of individuals. The average household size was 2.37 and the average family size was 2.89. The median age was 42.2 years.[18]
The median income for a household in the county was $38,016 and the median income for a family was $48,659. Males had a median income of $38,191 versus $27,347 for females. The per capita income for the county was $20,802. About 11.2% of families and 16.3% of the population were below the
Education
- Clay City Community Unit District 10
- Dieterich Community Unit School District 30
- Effingham Community Unit School District 40
- Flora Community Unit School District 35
- Jasper County Community Unit School District 1
- North Clay Community Unit School District 25
- South Central Community Unit School District 401
Politics
As part of
| Year | Republican | Democratic | Third party | |||
|---|---|---|---|---|---|---|
| No. | % | No. | % | No. | % | |
| 2020 | 5,629 | 81.59% | 1,129 | 16.36% | 141 | 2.04% |
| 2016 | 5,021 | 79.07% | 1,020 | 16.06% | 309 | 4.87% |
| 2012 | 4,190 | 70.92% | 1,584 | 26.81% | 134 | 2.27% |
| 2008 | 3,926 | 60.72% | 2,425 | 37.50% | 115 | 1.78% |
| 2004 | 4,416 | 67.38% | 2,101 | 32.06% | 37 | 0.56% |
| 2000 | 3,789 | 61.76% | 2,212 | 36.06% | 134 | 2.18% |
| 1996 | 2,703 | 43.40% | 2,750 | 44.16% | 775 | 12.44% |
| 1992 | 2,471 | 37.15% | 2,962 | 44.53% | 1,219 | 18.33% |
| 1988 | 3,494 | 55.65% | 2,761 | 43.97% | 24 | 0.38% |
| 1984 | 4,562 | 64.22% | 2,524 | 35.53% | 18 | 0.25% |
| 1980 | 4,447 | 61.20% | 2,587 | 35.60% | 232 | 3.19% |
| 1976 | 3,860 | 49.94% | 3,837 | 49.64% | 32 | 0.41% |
| 1972 | 5,283 | 64.92% | 2,844 | 34.95% | 11 | 0.14% |
| 1968 | 4,429 | 55.46% | 2,878 | 36.04% | 679 | 8.50% |
| 1964 | 3,665 | 44.61% | 4,551 | 55.39% | 0 | 0.00% |
| 1960 | 5,134 | 60.13% | 3,394 | 39.75% | 10 | 0.12% |
| 1956 | 5,079 | 58.73% | 3,553 | 41.08% | 16 | 0.19% |
| 1952 | 5,254 | 60.38% | 3,432 | 39.44% | 15 | 0.17% |
| 1948 | 3,782 | 53.21% | 3,160 | 44.46% | 166 | 2.34% |
| 1944 | 4,484 | 55.29% | 3,531 | 43.54% | 95 | 1.17% |
| 1940 | 5,185 | 50.72% | 4,934 | 48.27% | 103 | 1.01% |
| 1936 | 4,528 | 48.25% | 4,752 | 50.64% | 104 | 1.11% |
| 1932 | 3,373 | 41.83% | 4,565 | 56.61% | 126 | 1.56% |
| 1928 | 4,522 | 65.16% | 2,418 | 34.84% | 0 | 0.00% |
| 1924 | 3,432 | 49.60% | 2,987 | 43.17% | 500 | 7.23% |
| 1920 | 3,683 | 59.90% | 2,358 | 38.35% | 108 | 1.76% |
| 1916 | 3,879 | 50.43% | 3,574 | 46.46% | 239 | 3.11% |
| 1912 | 1,622 | 37.36% | 1,926 | 44.37% | 793 | 18.27% |
| 1908 | 2,250 | 49.53% | 2,152 | 47.37% | 141 | 3.10% |
| 1904 | 2,408 | 53.19% | 1,935 | 42.74% | 184 | 4.06% |
| 1900 | 2,356 | 49.45% | 2,295 | 48.17% | 113 | 2.37% |
| 1896 | 2,155 | 47.89% | 2,272 | 50.49% | 73 | 1.62% |
| 1892 | 1,774 | 45.64% | 1,604 | 41.27% | 509 | 13.09% |
See also
38°46′N 88°29′W / 38.76°N 88.49°W
References
- ^ "Clay County, Illinois". United States Census Bureau. Retrieved June 8, 2023.
- ^ "Find a County". National Association of Counties. Archived from the original on May 31, 2011. Retrieved June 7, 2011.
- ^ "Mean Center of Population for the United States: 1790 to 2000" (PDF). US Census Bureau. Archived from the original (PDF) on November 3, 2001. Retrieved September 17, 2011.
- ^ a b c d e "A History of Southern Illinois". The USGenWeb Project. 1912. pp. 439–442. Retrieved October 24, 2020.
- ^ Gannett, Henry (1905). The Origin of Certain Place Names in the United States. Govt. Print. Off. p. 83.
- ^ "Larry Brant - Village of Clay City". Archived from the original on February 28, 2009. Retrieved October 24, 2020.
- ^ Clay County IL (Google Maps, accessed 24 October 2020)
- ^ Clay County High Point IL (PeakBagger.com, accessed 24 October 2020)
- ^ a b "Population, Housing Units, Area, and Density: 2010 - County". US Census Bureau. Archived from the original on February 12, 2020. Retrieved July 11, 2015.
- ^ Martin T Snyder Nature Preserve, Flora IL (Google Maps, accessed 24 October 2020)
- ^ a b "Monthly Averages for Louisville, Illinois". The Weather Channel. Retrieved January 27, 2011.
- ^ "Annual Estimates of the Resident Population for Counties: April 1, 2020 to July 1, 2023". United States Census Bureau. Retrieved April 2, 2024.
- ^ "US Decennial Census". US Census Bureau. Retrieved July 4, 2014.
- ^ "Historical Census Browser". University of Virginia Library. Archived from the original on August 11, 2012. Retrieved July 4, 2014.
- ^ "Population of Counties by Decennial Census: 1900 to 1990". US Census Bureau. Retrieved July 4, 2014.
- ^ "Census 2000 PHC-T-4. Ranking Tables for Counties: 1990 and 2000" (PDF). US Census Bureau. Retrieved July 4, 2014.
- ^ "State & County QuickFacts". US Census Bureau. Archived from the original on June 6, 2011. Retrieved July 4, 2014.
- ^ a b c "Profile of General Population and Housing Characteristics: 2010 Demographic Profile Data". US Census Bureau. Archived from the original on February 13, 2020. Retrieved July 11, 2015.
- ^ "Selected Social Characteristics in the US – 2006-2010 American Community Survey 5-Year Estimates". US Census Bureau. Archived from the original on February 13, 2020. Retrieved July 11, 2015.
- ^ "Selected Economic Characteristics – 2006-2010 American Community Survey 5-Year Estimates". US Census Bureau. Archived from the original on February 13, 2020. Retrieved July 11, 2015.
- ^ Cohn, Nate; ‘Demographic Shift: Southern Whites’ Loyalty to G.O.P. Nearing That of Blacks to Democrats’, The New York Times, April 24, 2014
- ^ Leip, David. "Atlas of US Presidential Elections". uselectionatlas.org. Retrieved October 31, 2018.
- United States Census Bureau 2007 TIGER/Line Shapefiles
- United States Board on Geographic Names (GNIS)
- United States National Atlas
External links
Places adjacent to Clay County, Illinois | ||||||||||||||||
|---|---|---|---|---|---|---|---|---|---|---|---|---|---|---|---|---|
| ||||||||||||||||
 | ||||
Villages | ||||
| Townships | ||||
| Unincorporated communities | ||||
| Ghost town | ||||
| Footnotes | ‡This populated place also has portions in an adjacent county or counties | |||
| ||||
| Counties |  | |
|---|---|---|
| Mid-sized cities (25,000+) | ||
| Small cities (10,000-25,000) | ||
| Small cities (5,000-10,000) | ||
| Transit systems | ||
| Amtrak stations | ||
| Interstates | ||
| Airports/military bases |
| |
| Universities | ||
| Colleges | ||
| Sports teams based in Southern Illinois | ||
| International | |
|---|---|
| National | |
| Other | |