
Sangamon County, Illinois
Sangamon County | |
|---|---|
 Sangamon County Courthouse in 2017 | |
 Flag  Seal | |
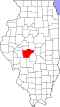
 Location within the U.S. state of Illinois | |
 Illinois's location within the U.S. | |
| Coordinates: 39°46′N 89°40′W / 39.76°N 89.66°W | |
| Country | |
| State | |
| Founded | 1821 |
| Named after | Sangamon River |
| Seat | Springfield |
| Largest city | Springfield |
| Area | |
• Total | 877 sq mi (2,270 km2) |
| • Land | 868 sq mi (2,250 km2) |
| • Water | 8.7 sq mi (23 km2) 1.0% |
| Population (2020) | |
• Total | 196,343 |
| • Density | 220/sq mi (86/km2) |
| Congressional districts | 13th, 15th |
| Website | www |
Sangamon County is a county located near the center of the U.S. state of Illinois. According to the 2020 census, it had a population of 196,343.[1] Its county seat and largest city is Springfield,[2] the state capital.
Sangamon County is included in the Springfield, IL Metropolitan Statistical Area.
History

Sangamon County was formed in 1821 out of
Prior to being elected
-
 Sangamon County from the time of its creation to 1823
 -
 Sangamon County between 1823 and 1825
 -
 Sangamon County between 1825 and 1839
 -
 Sangamon in 1839, when the creation of Logan and Menard Counties reduced it to its present borders


Geography
According to the U.S. Census Bureau, the county has a total area of 877 square miles (2,270 km2), of which 868 square miles (2,250 km2) is land and 8.7 square miles (23 km2) (1.0%) is water.[4]
Climate and weather
| Springfield, Illinois | ||||||||||||||||||||||||||||||||||||||||||||||||||||||||||||
|---|---|---|---|---|---|---|---|---|---|---|---|---|---|---|---|---|---|---|---|---|---|---|---|---|---|---|---|---|---|---|---|---|---|---|---|---|---|---|---|---|---|---|---|---|---|---|---|---|---|---|---|---|---|---|---|---|---|---|---|---|
| Climate chart (explanation) | ||||||||||||||||||||||||||||||||||||||||||||||||||||||||||||
| ||||||||||||||||||||||||||||||||||||||||||||||||||||||||||||
| ||||||||||||||||||||||||||||||||||||||||||||||||||||||||||||
In recent years, average temperatures in the county seat of Springfield have ranged from a low of 17 °F (−8 °C) in January to a high of 87 °F (31 °C) in July, although a record low of −24 °F (−31 °C) was recorded in February 1905 and a record high of 112 °F (44 °C) was recorded in July 1954. Average monthly precipitation ranged from 1.62 inches (41 mm) in January to 4.06 inches (103 mm) in May.[5]
Major highways
 Interstate 55
- Interstate 55 Business Loop
 Interstate 72
 U.S. Route 36
 Illinois Route 4
 Illinois Route 29
 Illinois Route 54
 Illinois Route 97
 Illinois Route 104
 Illinois Route 124
 Illinois Route 123
 Illinois Route 125
Transit
Adjacent counties
- Menard County – north
- Logan County – northeast
- Macon County – east
- Christian County – southeast
- Montgomery County – south
- Macoupin County – south
- Morgan County – west
- Cass County – northwest
National protected areas
- Lincoln Home National Historic Site
- Springfield 1908 Race Riot National Monument
State protected areas
Demographics
| Census | Pop. | Note | %± |
|---|---|---|---|
| 1830 | 12,960 | — | |
| 1840 | 14,716 | 13.5% | |
| 1850 | 19,228 | 30.7% | |
| 1860 | 32,274 | 67.8% | |
| 1870 | 46,352 | 43.6% | |
| 1880 | 52,894 | 14.1% | |
| 1890 | 61,195 | 15.7% | |
| 1900 | 71,593 | 17.0% | |
| 1910 | 91,024 | 27.1% | |
| 1920 | 100,262 | 10.1% | |
| 1930 | 111,733 | 11.4% | |
| 1940 | 117,912 | 5.5% | |
| 1950 | 131,484 | 11.5% | |
| 1960 | 146,539 | 11.5% | |
| 1970 | 161,335 | 10.1% | |
| 1980 | 176,089 | 9.1% | |
| 1990 | 178,386 | 1.3% | |
| 2000 | 188,951 | 5.9% | |
| 2010 | 197,465 | 4.5% | |
| 2020 | 196,343 | −0.6% | |
| 2023 (est.) | 193,491 | [6] | −1.5% |
| U.S. Decennial Census[7] 1790–1960[8] 1900–1990[9] 1990–2000[10] 2010[11] | |||
As of the
Of the 82,986 households, 30.4% had children under the age of 18 living with them, 44.4% were married couples living together, 13.2% had a female householder with no husband present, 38.1% were non-families, and 31.8% of all households were made up of individuals. The average household size was 2.33 and the average family size was 2.94. The median age was 39.2 years.[12]
The median income for a household in the county was $52,232 and the median income for a family was $66,917. Males had a median income of $48,324 versus $36,691 for females. The per capita income for the county was $28,394. About 9.9% of families and 13.4% of the population were below the
Government
Sangamon County is governed by a 29-member board. Each member of the board is elected from a separate district.[15]
Other elected officials include:[16]
| Office | Representative | Party | Residence | Took Office |
|---|---|---|---|---|
| Auditor | Andy Goleman | Republican | Divernon | 2015 (appointed) |
| Clerk of the Circuit Court | Paul Palazzolo | Republican | Springfield | 2015 (appointed) |
| Coroner | James Allmon | Republican | Springfield | 2020 (appointed) |
| County Clerk | Don Gray | Republican | Springfield | 2015 (appointed) |
| Recorder | Josh Langfelder | Democratic | Springfield | 2008 (elected) |
| Regional Superintendent of Schools | Shannon Fehrholz | Republican | Springfield | 2010 (appointed) |
| Sheriff | Jack Campbell | Republican | Illiopolis | 2018 (elected) |
| State's Attorney | John Milhiser | Republican | Springfield | 2023 (appointed) |
| Treasurer | Joe Aiello | Republican | Springfield | 2018 (elected) |
Politics
Sangamon County has been a Republican stronghold for decades, consistently supporting GOP candidates in local, state, and national elections. Despite its relatively large population and the presence of Springfield, the state's capital and a significant urban center, the county has remained reliably conservative. In recent years, however, the county has shown signs of shifting toward the Democratic Party, reflecting changing demographics and political attitudes, although Democrats have remained unable to carry the county in most races.
Sheriff department
In 2024, sheriff deputy Sean Grayson was fired after
| Year | Republican | Democratic | Third party(ies) | |||
|---|---|---|---|---|---|---|
| No. | % | No. | % | No. | % | |
| 2024 | 50,979 | 51.09% | 46,074 | 46.18% | 2,720 | 2.73% |
| 2020 | 53,485 | 50.87% | 48,917 | 46.52% | 2,740 | 2.61% |
| 2016 | 49,944 | 50.77% | 40,907 | 41.58% | 7,522 | 7.65% |
| 2012 | 50,225 | 53.26% | 42,107 | 44.65% | 1,965 | 2.08% |
| 2008 | 46,945 | 46.90% | 51,300 | 51.25% | 1,861 | 1.86% |
| 2004 | 55,904 | 58.61% | 38,630 | 40.50% | 841 | 0.88% |
| 2000 | 50,374 | 55.06% | 38,414 | 41.99% | 2,697 | 2.95% |
| 1996 | 42,174 | 47.87% | 38,902 | 44.15% | 7,029 | 7.98% |
| 1992 | 39,641 | 40.93% | 40,052 | 41.35% | 17,167 | 17.72% |
| 1988 | 50,175 | 56.76% | 37,729 | 42.68% | 499 | 0.56% |
| 1984 | 54,086 | 61.10% | 34,059 | 38.47% | 378 | 0.43% |
| 1980 | 49,372 | 57.95% | 29,354 | 34.45% | 6,474 | 7.60% |
| 1976 | 43,309 | 52.24% | 38,017 | 45.85% | 1,584 | 1.91% |
| 1972 | 50,458 | 65.47% | 25,720 | 33.37% | 897 | 1.16% |
| 1968 | 36,510 | 50.02% | 29,542 | 40.47% | 6,944 | 9.51% |
| 1964 | 33,077 | 43.43% | 43,073 | 56.55% | 16 | 0.02% |
| 1960 | 41,483 | 53.64% | 35,793 | 46.28% | 59 | 0.08% |
| 1956 | 42,951 | 59.71% | 28,949 | 40.24% | 35 | 0.05% |
| 1952 | 39,392 | 53.99% | 33,526 | 45.95% | 50 | 0.07% |
| 1948 | 33,714 | 53.28% | 29,196 | 46.14% | 363 | 0.57% |
| 1944 | 32,871 | 53.24% | 28,713 | 46.50% | 161 | 0.26% |
| 1940 | 35,464 | 52.44% | 31,943 | 47.23% | 221 | 0.33% |
| 1936 | 29,562 | 46.43% | 32,281 | 50.70% | 1,827 | 2.87% |
| 1932 | 26,856 | 44.29% | 32,745 | 54.00% | 1,042 | 1.72% |
| 1928 | 31,957 | 59.99% | 21,026 | 39.47% | 288 | 0.54% |
| 1924 | 23,443 | 51.58% | 12,640 | 27.81% | 9,363 | 20.60% |
| 1920 | 21,820 | 59.42% | 11,000 | 29.95% | 3,903 | 10.63% |
| 1916 | 20,900 | 51.65% | 17,958 | 44.38% | 1,606 | 3.97% |
| 1912 | 6,196 | 31.14% | 8,406 | 42.25% | 5,295 | 26.61% |
| 1908 | 10,422 | 49.79% | 9,351 | 44.67% | 1,161 | 5.55% |
| 1904 | 10,638 | 53.44% | 7,571 | 38.03% | 1,697 | 8.53% |
| 1900 | 9,769 | 49.61% | 9,499 | 48.24% | 422 | 2.14% |
| 1896 | 8,998 | 50.17% | 8,582 | 47.85% | 354 | 1.97% |
| 1892 | 6,009 | 41.06% | 7,665 | 52.38% | 960 | 6.56% |
Communities
Cities
- Auburn
- Leland Grove
- Springfield (county seat and largest municipality)
- Virden
Villages
Unincorporated communities
Townships
Sangamon County is divided into these townships:
- Auburn
- Ball
- Buffalo Hart
- Capital(Coterminous with Springfield)
- Cartwright
- Chatham
- Clear Lake
- Cooper
- Cotton Hill
- Curran
- Divernon
- Fancy Creek
- Gardner
- Illiopolis
- Island Grove
- Lanesville
- Loami
- Maxwell
- Mechanicsburg
- New Berlin
- Pawnee
- Rochester
- Salisbury (former, now defunct)
- Springfield
- Talkington
- Williams
- Woodside
Education
Here is a listing of school districts (all are full K–12) with any territory in this county, no matter how small, even if the administrative headquarters and/or schools are in other counties:[21]
- A-C Central Community Unit School District 262
- Community Unit School District 16
- Athens Community Unit School District 213
- Auburn Community Unit School District 10
- Ball-Chatham Community Unit School District 5
- Edinburg Community Unit School District 4
- Mount Pulaski Community Unit District 23
- North Mac Community Unit School District 34
- Pawnee Community Unit School District 11
- Porta Community Unit School District 202
- Pleasant Plains Community Unit School District 8
- Riverton Community Unit School District 14
- Rochester Community Unit School District 3A
- Sangamon Valley Community Unit School District 9
- Springfield School District 186
- Tri-City Community Unit School District 1
- Waverly Community Unit School District 6
- Williamsville Community Unit School District 15
Forts
See also
References
- ^ "Sangamon County, Illinois". United States Census Bureau. Retrieved June 10, 2023.
- ^ "Find a County". National Association of Counties. Retrieved June 7, 2011.
- ^ Callary, Edward. 2009. Place Names of Illinois. Champaign: University of Illinois Press, p. 310.
- ^ a b "Population, Housing Units, Area, and Density: 2010 - County". United States Census Bureau. Archived from the original on February 12, 2020. Retrieved July 12, 2015.
- ^ a b "Monthly Averages for Springfield, Illinois". The Weather Channel. Retrieved January 27, 2011.
- ^ "Annual Estimates of the Resident Population for Counties: April 1, 2020 to July 1, 2023". United States Census Bureau. Retrieved April 2, 2024.
- ^ "U.S. Decennial Census". United States Census Bureau. Retrieved July 8, 2014.
- ^ "Historical Census Browser". University of Virginia Library. Retrieved July 8, 2014.
- ^ "Population of Counties by Decennial Census: 1900 to 1990". United States Census Bureau. Retrieved July 8, 2014.
- ^ "Census 2000 PHC-T-4. Ranking Tables for Counties: 1990 and 2000" (PDF). United States Census Bureau. Retrieved July 8, 2014.
- ^ "State & County QuickFacts". United States Census Bureau. Archived from the original on June 6, 2011. Retrieved July 8, 2014.
- ^ a b c "DP-1 Profile of General Population and Housing Characteristics: 2010 Demographic Profile Data". United States Census Bureau. Archived from the original on February 13, 2020. Retrieved July 12, 2015.
- ^ "DP02 SELECTED SOCIAL CHARACTERISTICS IN THE UNITED STATES – 2006-2010 American Community Survey 5-Year Estimates". United States Census Bureau. Archived from the original on February 13, 2020. Retrieved July 12, 2015.
- ^ "DP03 SELECTED ECONOMIC CHARACTERISTICS – 2006-2010 American Community Survey 5-Year Estimates". United States Census Bureau. Archived from the original on February 13, 2020. Retrieved July 12, 2015.
- ^ "History and Overview". Springfield, Illinois: County of Sangamon, Illinois. Archived from the original on December 5, 2011. Retrieved December 4, 2011.
- ^ "Elected Officials - Sangamon County Clerk - Don Gray - Sangamon County, Illinois". www.sangamoncountyclerk.com.
- ISSN 0362-4331. Retrieved July 23, 2024.
- ^ Olsen, Dean. "'Red flags' surrounded hiring of alleged killer". Illinois Times. Retrieved July 23, 2024.
- ^ "Sangamon County sheriff, whose deputy fatally shot Sonya Massey, announces resignation". ksdk.com. August 9, 2024. Retrieved October 11, 2024.
- ^ Leip, David. "Dave Leip's Atlas of U.S. Presidential Elections". uselectionatlas.org.
- U.S. Census Bureau. Retrieved July 20, 2022. Text list
External links
Places adjacent to Sangamon County, Illinois | ||||||||||||||||
|---|---|---|---|---|---|---|---|---|---|---|---|---|---|---|---|---|
| ||||||||||||||||
 | ||||
Villages | ||||
| Townships | ||||
| Unincorporated communities | ||||
| Footnotes | ‡This city also has portions in adjacent county or counties | |||
| ||||
| International | |
|---|---|
| National | |
| Geographic | |
| Other | |