
Venn diagram: Difference between revisions
Extended confirmed users 1,655 edits →History: mordern example Tags: Reverted Visual edit |
Undo |
||
| Line 36: | Line 36: | ||
[[Charles L. Dodgson]] (Lewis Carroll) includes "Venn's Method of Diagrams" as well as "Euler's Method of Diagrams" in an "Appendix, Addressed to Teachers" of his book ''Symbolic Logic'' (4th edition published in 1896). The term "Venn diagram" was later used by [[Clarence Irving Lewis]] in 1918, in his book ''A Survey of Symbolic Logic''.<ref name="Ruskey2005"/><ref name="Lewis1918"/> |
[[Charles L. Dodgson]] (Lewis Carroll) includes "Venn's Method of Diagrams" as well as "Euler's Method of Diagrams" in an "Appendix, Addressed to Teachers" of his book ''Symbolic Logic'' (4th edition published in 1896). The term "Venn diagram" was later used by [[Clarence Irving Lewis]] in 1918, in his book ''A Survey of Symbolic Logic''.<ref name="Ruskey2005"/><ref name="Lewis1918"/> |
||
[[File:AI-Generated Venn Diagram Comparing the Morrisite War and the Waco Siege.png|thumb|A venn diogram created by [[ChatGPT]] comparing the [[Morrisite War]] and the [[Waco siege]]]] |
|||
In the 20th century, Venn diagrams were further developed. [[David Wilson Henderson]] showed, in 1963, that the existence of an ''n''-Venn diagram with ''n''-fold [[rotational symmetry]] implied that ''n'' was a [[prime number]].<ref name="Henderson_1963"/> He also showed that such symmetric Venn diagrams exist when ''n'' is five or seven. In 2002, Peter Hamburger found symmetric Venn diagrams for ''n'' = 11 and in 2003, Griggs, Killian, and Savage showed that symmetric Venn diagrams exist for all other primes. These combined results show that rotationally symmetric Venn diagrams exist, if and only if ''n'' is a prime number.<ref name="Ruskey_2006"/> |
In the 20th century, Venn diagrams were further developed. [[David Wilson Henderson]] showed, in 1963, that the existence of an ''n''-Venn diagram with ''n''-fold [[rotational symmetry]] implied that ''n'' was a [[prime number]].<ref name="Henderson_1963"/> He also showed that such symmetric Venn diagrams exist when ''n'' is five or seven. In 2002, Peter Hamburger found symmetric Venn diagrams for ''n'' = 11 and in 2003, Griggs, Killian, and Savage showed that symmetric Venn diagrams exist for all other primes. These combined results show that rotationally symmetric Venn diagrams exist, if and only if ''n'' is a prime number.<ref name="Ruskey_2006"/> |
||
Revision as of 10:46, 11 May 2024
| Part of a series on statistics |
| Probability theory |
|---|
 |
A Venn diagram is a widely used diagram style that shows the logical relation between sets, popularized by John Venn (1834–1923) in the 1880s. The diagrams are used to teach elementary set theory, and to illustrate simple set relationships in probability, logic, statistics, linguistics and computer science. A Venn diagram uses simple closed curves drawn on a plane to represent sets. Very often, these curves are circles or ellipses.
Similar ideas had been proposed before Venn such as by Christian Weise in 1712 (Nucleus Logicoe Wiesianoe) and Leonhard Euler (Letters to a German Princess) in 1768. The idea was popularised by Venn in Symbolic Logic, Chapter V "Diagrammatic Representation", published in 1881.
Details
A Venn diagram, also called a set diagram or logic diagram, shows all possible logical relations between a finite collection of different sets. These diagrams depict elements as points in the plane, and sets as regions inside closed curves. A Venn diagram consists of multiple overlapping closed curves, usually circles, each representing a set. The points inside a curve labelled S represent elements of the set S, while points outside the boundary represent elements not in the set S. This lends itself to intuitive visualizations; for example, the set of all elements that are members of both sets S and T, denoted S ∩ T and read "the intersection of S and T", is represented visually by the area of overlap of the regions S and T.[1]
In Venn diagrams, the curves are overlapped in every possible way, showing all possible relations between the sets. They are thus a special case of Euler diagrams, which do not necessarily show all relations. Venn diagrams were conceived around 1880 by John Venn. They are used to teach elementary set theory, as well as illustrate simple set relationships in probability, logic, statistics, linguistics, and computer science.
A Venn diagram in which the area of each shape is proportional to the number of elements it contains is called an area-proportional (or scaled) Venn diagram.
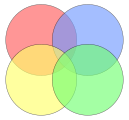
Example

This example involves two sets of creatures, represented here as colored circles. The orange circle represents all types of creatures that have two legs. The blue circle represents creatures that can fly. Each separate type of creature can be imagined as a point somewhere in the diagram. Living creatures that have two legs and can fly—for example, parrots—are then in both sets, so they correspond to points in the region where the blue and orange circles overlap. This overlapping region would only contain those elements (in this example, creatures) that are members of both the orange set (two-legged creatures) and the blue set (flying creatures).
Humans and penguins are bipedal, and so are in the orange circle, but since they cannot fly, they appear in the left part of the orange circle, where it does not overlap with the blue circle. Mosquitoes can fly, but have six, not two, legs, so the point for mosquitoes is in the part of the blue circle that does not overlap with the orange one. Creatures that are neither two-legged nor able to fly (for example, whales and spiders) would all be represented by points outside both circles.
The combined region of the two sets is called their union, denoted by A ∪ B, where A is the orange circle and B the blue.[2] The union in this case contains all living creatures that either are two-legged or can fly (or both). The region included in both A and B, where the two sets overlap, is called the intersection of A and B, denoted by A ∩ B.[2]
History
Venn diagrams were introduced in 1880 by
Venn diagrams are very similar to Euler diagrams, which were invented by Leonhard Euler in the 18th century.[note 1][9][10] Margaret Baron has noted that Leibniz (1646–1716) produced similar diagrams before Euler in the 17th century, but much of it was unpublished.[11] She also observes even earlier Euler-like diagrams by Ramon Llull in the 13th century.[12]
Venn did not use the term "Venn diagram" and referred to the concept as "Eulerian Circles".
Venn viewed his diagrams as a pedagogical tool, analogous to verification of physical concepts through experiment. As an example of their applications, he noted that a three-set diagram could show the syllogism: 'All A is some B. No B is any C. Hence, no A is any C.'[13]
In the 20th century, Venn diagrams were further developed.
Venn diagrams and Euler diagrams were incorporated as part of instruction in set theory, as part of the
Overview
-
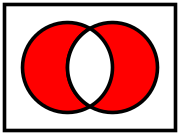
 Intersection of two sets
 -
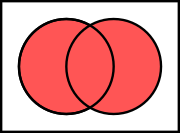 Union of two sets
 -
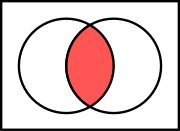
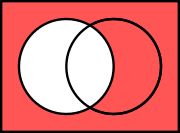
 Symmetric difference of two sets
 -
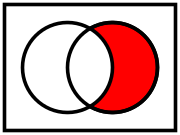 Relative complement of A (left) in B (right)
 -
 Absolute complement of A in U


A Venn diagram is constructed with a collection of simple closed curves drawn in a plane. According to Lewis,[14] the "principle of these diagrams is that classes [or sets] be represented by regions in such relation to one another that all the possible logical relations of these classes can be indicated in the same diagram. That is, the diagram initially leaves room for any possible relation of the classes, and the actual or given relation, can then be specified by indicating that some particular region is null or is not-null".[14]: 157
Venn diagrams normally comprise overlapping circles. The interior of the circle symbolically represents the elements of the set, while the exterior represents elements that are not members of the set. For instance, in a two-set Venn diagram, one circle may represent the group of all wooden objects, while the other circle may represent the set of all tables. The overlapping region, or intersection, would then represent the set of all wooden tables. Shapes other than circles can be employed as shown below by Venn's own higher set diagrams. Venn diagrams do not generally contain information on the relative or absolute sizes (cardinality) of sets. That is, they are schematic diagrams generally not drawn to scale.
Venn diagrams are similar to Euler diagrams. However, a Venn diagram for n component sets must contain all 2n hypothetically possible zones, that correspond to some combination of inclusion or exclusion in each of the component sets.[18] Euler diagrams contain only the actually possible zones in a given context. In Venn diagrams, a shaded zone may represent an empty zone, whereas in an Euler diagram, the corresponding zone is missing from the diagram. For example, if one set represents dairy products and another cheeses, the Venn diagram contains a zone for cheeses that are not dairy products. Assuming that in the context cheese means some type of dairy product, the Euler diagram has the cheese zone entirely contained within the dairy-product zone—there is no zone for (non-existent) non-dairy cheese. This means that as the number of contours increases, Euler diagrams are typically less visually complex than the equivalent Venn diagram, particularly if the number of non-empty intersections is small.[19]
The difference between Euler and Venn diagrams can be seen in the following example. Take the three sets:


The Euler and the Venn diagram of those sets are:
-
 Euler diagram
 -
 Venn diagram


Extensions to higher numbers of sets
Venn diagrams typically represent two or three sets, but there are forms that allow for higher numbers. Shown below, four intersecting spheres form the highest order Venn diagram that has the symmetry of a simplex and can be visually represented. The 16 intersections correspond to the vertices of a tesseract (or the cells of a 16-cell, respectively).

|

|

|

|

|
For higher numbers of sets, some loss of symmetry in the diagrams is unavoidable. Venn was keen to find "symmetrical figures ... elegant in themselves,"[9] that represented higher numbers of sets, and he devised an elegant four-set diagram using ellipses (see below). He also gave a construction for Venn diagrams for any number of sets, where each successive curve that delimits a set interleaves with previous curves, starting with the three-circle diagram.
-
 Venn's construction for four sets (use Gray code to compute, the digit 1 means in the set, and the digit 0 means not in the set)
 -
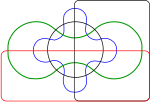
 Venn's construction for five sets
 -
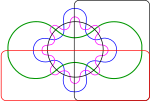
 Venn's construction for six sets
 -
 Venn's four-set diagram using ellipses
 -
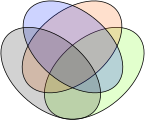
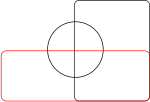
 Non-example: This Euler diagram is not a Venn diagram for four sets as it has only 14 regions as opposed to 24 = 16 regions (including the white region); there is no region where only the yellow and blue, or only the red and green circles meet.
 -
 Five-set Venn diagram using congruent ellipses in a five-fold rotationally symmetrical arrangement devised by Branko Grünbaum. Labels have been simplified for greater readability; for example, A denotes A ∩ Bc ∩ Cc ∩ Dc ∩ Ec, while BCE denotes Ac ∩ B ∩ C ∩ Dc ∩ E.
 -
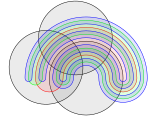
 Six-set Venn diagram made of only triangles (interactive version)


Edwards–Venn diagrams
-
 Three sets
 -
 Four sets
 -
 Five sets
 -
 Six sets


Other diagrams
Edwards–Venn diagrams are

Related concepts

Venn diagrams correspond to truth tables for the propositions , , etc., in the sense that each region of Venn diagram corresponds to one row of the truth table.


See also
- Existential graph (by Charles Sanders Peirce)
- Logical connectives
- Information diagram
- Veitch chart and Karnaugh map)
- Spherical octahedron – A stereographic projection of a regular octahedron makes a three-set Venn diagram, as three orthogonal great circles, each dividing space into two halves.
- Stanhope Demonstrator
- Three circles model
- Triquetra
- Vesica piscis
Notes
- ^ In Euler's Lettres à une princesse d'Allemagne sur divers sujets de physique et de philosophie [Letters to a German Princess on various physical and philosophical subjects] (Saint Petersburg, Russia: l'Academie Impériale des Sciences, 1768), volume 2, pages 95-126. In Venn's article, however, he suggests that the diagrammatic idea predates Euler, and is attributable to Christian Weise or Johann Christian Lange (in Lange's book Nucleus Logicae Weisianae (1712)).
References
- ^ "Intersection of Sets". web.mnstate.edu. Archived from the original on 2020-08-04. Retrieved 2020-09-05.
- ^ a b "Sets and Venn Diagrams". www.mathsisfun.com. Retrieved 2020-09-05.
- ^ Venn, John. "On the Diagrammatic and Mechanical Representation of Propositions and Reasonings" (PDF). Penn Engineering.
- ^ "The Philosophical Magazine: A Journal of Theoretical Experimental and Applied Physics". Taylor & Francis. Retrieved 2021-08-06.
- ^
- ^ Proceedings of the Cambridge Philosophical Society. 4: 47–59.
- ^ The Mathematical Association of America(MAA). Retrieved 2009-10-26.
- ^ The Electronic Journal of Combinatorics.
- ^ Macmillan. p. 108. Retrieved 2013-04-09.
- ^ Mac Queen, Gailand (October 1967). The Logic Diagram (PDF) (Thesis). McMaster University. Archived from the original (PDF) on 2017-04-14. Retrieved 2017-04-14. (NB. Has a detailed history of the evolution of logic diagrams including but not limited to the Venn diagram.)
- ^ Leibniz, Gottfried Wilhelm (1903) [ca. 1690]. "De Formae Logicae per linearum ductus". In Couturat, Louis (ed.). Opuscules et fragmentes inedits de Leibniz (in Latin). pp. 292–321.
- S2CID 125364002.
- ^ a b Verburgt, Lukas M. (April 2023). "The Venn Behind the Diagram". Mathematics Today. Vol. 59, no. 2. Institute of Mathematics and its Applications. pp. 53–55.
- ^ Lewis, Clarence Irving (1918). A Survey of Symbolic Logic. Berkeley: University of California Press.
- JSTOR 2311865.
- Notices of the AMS. 53 (11): 1304–1311.
- ^ "Strategies for Reading Comprehension Venn Diagrams". Archived from the original on 2009-04-29. Retrieved 2009-06-20.
- ^ Weisstein, Eric W. "Venn Diagram". mathworld.wolfram.com. Retrieved 2020-09-05.
- ^ "Euler Diagrams 2004: Brighton, UK: September 22–23". Reasoning with Diagrams project, University of Kent. 2004. Retrieved 2008-08-13.
- ^ ISBN 978-0-8018-7434-5..
- from the original on 2018-11-21. Retrieved 2020-05-12.
- ISBN 978-0-201-72634-3.
- ISBN 978-3-540-76123-5.
Further reading
- Mahmoodian, Ebadollah S.; Rezaie, M.; Vatan, F. (March 1987). "Generalization of Venn Diagram" (PDF). Eighteenth Annual Iranian Mathematics Conference. Tehran and Isfahan, Iran. Archived from the original (PDF) on 2017-05-01. Retrieved 2017-05-01.
- Edwards, Anthony William Fairbank (1989-01-07). "Venn diagrams for many sets". New Scientist. 121 (1646): 51–56.
- Watkinson, John (1990). "4.10. Hamming distance". Coding for Digital Recording. Stoneham, MA, USA: ISBN 978-0-240-51293-8. (NB. The book comes with a 3-page foldout of a seven-bit cylindrical Venn diagram.)
- ISBN 978-0-486-43181-9.
- ISBN 978-1568812311.
- Mamakani, Khalegh; Bibcode:2012arXiv1207.6452M. Archivedfrom the original on 2017-05-01. Retrieved 2017-05-01.
External links
- "Venn diagram", Encyclopedia of Mathematics, EMS Press, 2001 [1994]
- Lewis Carroll's Logic Game – Venn vs. Euler at Cut-the-knot
- Six sets Venn diagrams made from triangles
- Interactive seven sets Venn diagram
- VBVenn a free open source program for calculating and graphing quantitative two-circle Venn diagrams
| General | |||||||||
|---|---|---|---|---|---|---|---|---|---|
| Theorems (list) and paradoxes | |||||||||
| Logics |
| ||||||||
| Set theory |
| ||||||||
| Formal systems (list), language and syntax |
| ||||||||
| Proof theory | |||||||||
| Model theory |
| ||||||||
| Computability theory | |||||||||
| Related | |||||||||
| Overview |  | |
|---|---|---|
| Axioms | ||
| Operations |
| |
| ||
| Set types | ||
| Theories | ||
| ||
| Set theorists | ||
| Authority control databases: National |
|---|