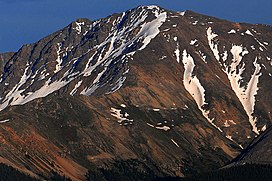
La Plata Peak
| La Plata Peak | |
|---|---|
 | |
| Highest point | |
| Elevation | 14,361 ft (4372 m)[1] NAVD88 |
| Prominence | 1836 ft (560 m)[1] |
| Isolation | 6.28 mi (10.11 km)[1] |
| Listing | |
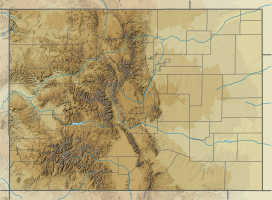
| Coordinates | 39°01′46″N 106°28′22″W / 39.0293524°N 106.4729047°W[2] |
| Geography | |
| Location | Hayden Survey |
| Easiest route | Northwest Ridge or Southwest Ridge: Hike (class 2) |
La Plata Peak is the
"La Plata" is Spanish for "The Silver", a reference to the many silver deposits in the area. The nearby ghost towns of
The elevation of 14,361 feet marked on the
Climbing Routes
Northwest Ridge: This is the standard route used to climb the mountain. like most Sawatch range 14ers it is non-technical, but incredibly steep. The trail is 9.5 miles round trip, with 4,500 feet of elevation gain and class 2 hiking along the ridge.[5]
Ellingwood Ridge: Ellingwood Ridge is one of the most technically difficult alternate routes in the Sawatch range. it was first climbed by Albert Ellingwood in the 1930s.[6] It is rated as class 3, but the extremely difficult route finding and length of the climb make this a very challenging endeavor. Much of the climbing is off trail. The climb is 9.5 miles round trip, with 5,900 feet of elevation gain.[7]
Climate
| Climate data for La Plata Peak 39.0277 N, 106.4762 W, Elevation: 13,671 ft (4,167 m) (1991–2020 normals) | |||||||||||||
|---|---|---|---|---|---|---|---|---|---|---|---|---|---|
| Month | Jan | Feb | Mar | Apr | May | Jun | Jul | Aug | Sep | Oct | Nov | Dec | Year |
| Mean daily maximum °F (°C) | 21.0 (−6.1) |
20.2 (−6.6) |
25.6 (−3.6) |
31.5 (−0.3) |
40.2 (4.6) |
51.7 (10.9) |
57.5 (14.2) |
55.4 (13.0) |
49.1 (9.5) |
38.5 (3.6) |
27.4 (−2.6) |
21.1 (−6.1) |
36.6 (2.5) |
| Daily mean °F (°C) | 9.5 (−12.5) |
8.5 (−13.1) |
13.3 (−10.4) |
18.5 (−7.5) |
27.3 (−2.6) |
37.8 (3.2) |
43.6 (6.4) |
42.1 (5.6) |
35.9 (2.2) |
26.0 (−3.3) |
16.5 (−8.6) |
10.1 (−12.2) |
24.1 (−4.4) |
| Mean daily minimum °F (°C) | −1.9 (−18.8) |
−3.1 (−19.5) |
1.0 (−17.2) |
5.6 (−14.7) |
14.4 (−9.8) |
23.9 (−4.5) |
29.8 (−1.2) |
28.9 (−1.7) |
22.7 (−5.2) |
13.6 (−10.2) |
5.5 (−14.7) |
−1.0 (−18.3) |
11.6 (−11.3) |
| Average precipitation inches (mm) | 3.69 (94) |
3.64 (92) |
3.98 (101) |
4.65 (118) |
3.53 (90) |
1.58 (40) |
1.97 (50) |
2.11 (54) |
2.41 (61) |
2.89 (73) |
3.58 (91) |
3.32 (84) |
37.35 (948) |
| Source: PRISM Climate Group[8] | |||||||||||||
See also
Notes
- NGVD 29 to NAVD 88.
References
- ^ a b c d e "La Plata Peak, Colorado". Peakbagger.com. Retrieved January 2, 2016.
- ^ a b c d "La Plata Peak". Geographic Names Information System. United States Geological Survey, United States Department of the Interior. Retrieved October 20, 2014.
- ^ "La Plata Peak". SummitPost.org. Retrieved 2008-11-30.
- ISBN 978-1-55591-412-7.
- ^ Middlebrook, Bill. "La Plata Peak Northwest Ridge". 14ers.com. Retrieved 8 March 2022.
- ^ Teissier, Warren. "Rock Climb Ellingwood Ridge". Mountainproject.com. Retrieved 8 March 2022.
- ^ Snider, Brad. "La Plata Peak Ellingwood Ridge". 14ers.com. Retrieved 8 March 2022.
- ^ "PRISM Climate Group, Oregon State University". PRISM Climate Group, Oregon State University. Retrieved October 10, 2023.
To find the table data on the PRISM website, start by clicking Coordinates (under Location); copy Latitude and Longitude figures from top of table; click Zoom to location; click Precipitation, Minimum temp, Mean temp, Maximum temp; click 30-year normals, 1991-2020; click 800m; click Retrieve Time Series button.
External links
- "La Plata Peak". Colorado Fourteeners Initiative. Archived from the original on 2008-05-09. Retrieved 2008-11-30.
- "La Plata Peak Trail". San Isabel National Forest. US Forest Service. Retrieved 2008-11-30.
- "La Plata Peak". 14ers.com. Retrieved 2014-08-17.

