
Voronoi diagram

In
The Voronoi diagram is named after mathematician
The simplest case
In the simplest case, shown in the first picture, we are given a finite set of points in the Euclidean plane. In this case each site is one of these given points, and its corresponding Voronoi cell consists of every point in the Euclidean plane for which is the nearest site: the distance to is less than or equal to the minimum distance to any other site . For one other site , the points that are closer to than to , or equally distant, form a


Formal definition
Let be a metric space with distance function . Let be a set of indices and let be a


The Voronoi diagram is simply the tuple of cells . In principle, some of the sites can intersect and even coincide (an application is described below for sites representing shops), but usually they are assumed to be disjoint. In addition, infinitely many sites are allowed in the definition (this setting has applications in geometry of numbers and crystallography), but again, in many cases only finitely many sites are considered.

In the particular case where the space is a
In the usual Euclidean space, we can rewrite the formal definition in usual terms. Each Voronoi polygon is associated with a generator point . Let be the set of all points in the Euclidean space. Let be a point that generates its Voronoi region , that generates , and that generates , and so on. Then, as expressed by Tran et al,[7] "all locations in the Voronoi polygon are closer to the generator point of that polygon than any other generator point in the Voronoi diagram in Euclidean plane".


Illustration
As a simple illustration, consider a group of shops in a city. Suppose we want to estimate the number of customers of a given shop. With all else being equal (price, products, quality of service, etc.), it is reasonable to assume that customers choose their preferred shop simply by distance considerations: they will go to the shop located nearest to them. In this case the Voronoi cell of a given shop can be used for giving a rough estimate on the number of potential customers going to this shop (which is modeled by a point in our city).

For most cities, the distance between points can be measured using the familiar Euclidean distance:
![{\displaystyle \ell _{2}=d\left[\left(a_{1},a_{2}\right),\left(b_{1},b_{2}\right)\right]={\sqrt {\left(a_{1}-b_{1}\right)^{2}+\left(a_{2}-b_{2}\right)^{2}}}}](https://wikimedia.org/api/rest_v1/media/math/render/svg/4dbecd722552090b30fcd0166107f3a2cece7e8d)
or the
- .
![{\displaystyle d\left[\left(a_{1},a_{2}\right),\left(b_{1},b_{2}\right)\right]=\left|a_{1}-b_{1}\right|+\left|a_{2}-b_{2}\right|}](https://wikimedia.org/api/rest_v1/media/math/render/svg/9da43d1f11cfcb755e4600f943fe4c8dedd46263)
The corresponding Voronoi diagrams look different for different distance metrics.
Properties
- The dual graph for a Voronoi diagram (in the case of a Euclidean space with point sites) corresponds to the Delaunay triangulation for the same set of points.
- The closest pair of pointscorresponds to two adjacent cells in the Voronoi diagram.
- Assume the setting is the Euclidean plane and a discrete set of points is given. Then two points of the set are adjacent on the convex hull if and only if their Voronoi cells share an infinitely long side.
- If the space is a compact set or a closed ball), then each Voronoi cell can be represented as a union of line segments emanating from the sites.[8]As shown there, this property does not necessarily hold when the distance is not attained.
- Under relatively general conditions (the space is a possibly infinite-dimensional uniformly convex space, there can be infinitely many sites of a general form, etc.) Voronoi cells enjoy a certain stability property: a small change in the shapes of the sites, e.g., a change caused by some translation or distortion, yields a small change in the shape of the Voronoi cells. This is the geometric stability of Voronoi diagrams.[9] As shown there, this property does not hold in general, even if the space is two-dimensional (but non-uniformly convex, and, in particular, non-Euclidean) and the sites are points.
History and research
Informal use of Voronoi diagrams can be traced back to
Voronoi diagrams are named after Georgy Feodosievych Voronoy who defined and studied the general n-dimensional case in 1908.[11] Voronoi diagrams that are used in geophysics and meteorology to analyse spatially distributed data are called Thiessen polygons after American meteorologist Alfred H. Thiessen, who used them to estimate rainfall from scattered measurements in 1911. Other equivalent names for this concept (or particular important cases of it): Voronoi polyhedra, Voronoi polygons, domain(s) of influence, Voronoi decomposition, Voronoi tessellation(s), Dirichlet tessellation(s).
Examples

Voronoi tessellations of regular lattices of points in two or three dimensions give rise to many familiar tessellations.
- A 2D lattice gives an irregular honeycomb tessellation, with equal hexagons with point symmetry; in the case of a regular triangular lattice it is regular; in the case of a rectangular lattice the hexagons reduce to rectangles in rows and columns; a squarelattice gives the regular tessellation of squares; note that the rectangles and the squares can also be generated by other lattices (for example the lattice defined by the vectors (1,0) and (1/2,1/2) gives squares).
- A simple cubic lattice gives the cubic honeycomb.
- A hexagonal close-packed lattice gives a tessellation of space with trapezo-rhombic dodecahedra.
- A face-centred cubic lattice gives a tessellation of space with rhombic dodecahedra.
- A body-centred cubic lattice gives a tessellation of space with truncated octahedra.
- Parallel planes with regular triangular lattices aligned with each other's centers give the hexagonal prismatic honeycomb.
- Certain body-centered tetragonal lattices give a tessellation of space with rhombo-hexagonal dodecahedra.
Certain body-centered tetragonal lattices give a tessellation of space with
For the set of points (x, y) with x in a discrete set X and y in a discrete set Y, we get rectangular tiles with the points not necessarily at their centers.
Higher-order Voronoi diagrams
Although a normal Voronoi cell is defined as the set of points closest to a single point in S, an nth-order Voronoi cell is defined as the set of points having a particular set of n points in S as its n nearest neighbors. Higher-order Voronoi diagrams also subdivide space.
Higher-order Voronoi diagrams can be generated recursively. To generate the nth-order Voronoi diagram from set S, start with the (n − 1)th-order diagram and replace each cell generated by X = {x1, x2, ..., xn−1} with a Voronoi diagram generated on the set S − X.
Farthest-point Voronoi diagram
For a set of n points the (n − 1)th-order Voronoi diagram is called a farthest-point Voronoi diagram.
For a given set of points S = {p1, p2, ..., pn} the farthest-point Voronoi diagram divides the plane into cells in which the same point of P is the farthest point. A point of P has a cell in the farthest-point Voronoi diagram if and only if it is a vertex of the convex hull of P. Let H = {h1, h2, ..., hk} be the convex hull of P; then the farthest-point Voronoi diagram is a subdivision of the plane into k cells, one for each point in H, with the property that a point q lies in the cell corresponding to a site hi if and only if d(q, hi) > d(q, pj) for each pj ∈ S with hi ≠ pj, where d(p, q) is the Euclidean distance between two points p and q.[12][13]
The boundaries of the cells in the farthest-point Voronoi diagram have the structure of a
Generalizations and variations
As implied by the definition, Voronoi cells can be defined for metrics other than Euclidean, such as the

A
The Voronoi diagram of points in -dimensional space can have vertices, requiring the same bound for the amount of memory needed to store an explicit description of it. Therefore, Voronoi diagrams are often not feasible for moderate or high dimensions. A more space-efficient alternative is to use approximate Voronoi diagrams.[16]


Voronoi diagrams are also related to other geometric structures such as the medial axis (which has found applications in image segmentation, optical character recognition, and other computational applications), straight skeleton, and zone diagrams.
Applications
Meteorology/Hydrology
It is used in meteorology and engineering hydrology to find the weights for precipitation data of stations over an area (watershed). The points generating the polygons are the various station that record precipitation data. Perpendicular bisectors are drawn to the line joining any two stations. This results in the formation of polygons around the stations. The area touching station point is known as influence area of the station. The average precipitation is calculated by the formula


Humanities and social sciences
- In classical archaeology, specifically art history, the symmetry of statue heads is analyzed to determine the type of statue a severed head may have belonged to. An example of this that made use of Voronoi cells was the identification of the Sabouroff head, which made use of a high-resolution polygon mesh.[17][18]
- In dialectometry, Voronoi cells are used to indicate a supposed linguistic continuity between survey points.
- In political science, Voronoi diagrams have been used to study multi-dimensional, multi-party competition.[19]
Natural sciences

- In
- In hydrology, Voronoi diagrams are used to calculate the rainfall of an area, based on a series of point measurements. In this usage, they are generally referred to as Thiessen polygons.
- In ecology, Voronoi diagrams are used to study the growth patterns of forests and forest canopies, and may also be helpful in developing predictive models for forest fires.
- In ethology, Voronoi diagrams are used to model domains of danger in the selfish herd theory.
- In computational chemistry, ligand-binding sites are transformed into Voronoi diagrams for machine learning applications (e.g., to classify binding pockets in proteins).[23] In other applications, Voronoi cells defined by the positions of the nuclei in a molecule are used to compute atomic charges. This is done using the Voronoi deformation density method.
- In astrophysics, Voronoi diagrams are used to generate adaptative smoothing zones on images, adding signal fluxes on each one. The main objective of these procedures is to maintain a relatively constant signal-to-noise ratio on all the images.
- In finite volume methods, e.g. as in the moving-mesh cosmology code AREPO.[24]
- In computational physics, Voronoi diagrams are used to calculate profiles of an object with Shadowgraph and proton radiography in High energy density physics.[25]
Health
- In medical diagnosis, models of muscle tissue, based on Voronoi diagrams, can be used to detect neuromuscular diseases.[22]
- In John Snow to study the 1854 Broad Street cholera outbreak in Soho, England. He showed the correlation between residential areas on the map of Central London whose residents had been using a specific water pump, and the areas with the most deaths due to the outbreak.[26]
Engineering
- In polymer physics, Voronoi diagrams can be used to represent free volumes of polymers.
- In materials science, polycrystalline microstructures in metallic alloys are commonly represented using Voronoi tessellations.
- In island growth, the Voronoi diagram is used to estimate the growth rate of individual islands.[27][28][29][30][31]
- In Wigner-Seitz cell is the Voronoi tessellation of a solid, and the Brillouin zone is the Voronoi tessellation of reciprocal (wavenumber) space of crystals which have the symmetry of a space group.
- In aviation, Voronoi diagrams are superimposed on oceanic plotting charts to identify the nearest airfield for in-flight diversion (see ETOPS), as an aircraft progresses through its flight plan.
- In The Arts Centre Gold Coast.[32]
- In urban planning, Voronoi diagrams can be used to evaluate the Freight Loading Zone system.[33]
- In mining, Voronoi polygons are used to estimate the reserves of valuable materials, minerals, or other resources. Exploratory drillholes are used as the set of points in the Voronoi polygons.
- In surface metrology, Voronoi tessellation can be used for surface roughness modeling.[34]
- In robotics, some of the control strategies and path planning algorithms[35] of multi-robot systems are based on the Voronoi partitioning of the environment.[36][37]
Mathematics
- A point location data structure can be built on top of the Voronoi diagram in order to answer nearest neighbor queries, where one wants to find the object that is closest to a given query point. Nearest neighbor queries have numerous applications. For example, one might want to find the nearest hospital or the most similar object in a database. A large application is vector quantization, commonly used in data compression.
- In geometry, Voronoi diagrams can be used to find the largest empty circle amid a set of points, and in an enclosing polygon; e.g. to build a new supermarket as far as possible from all the existing ones, lying in a certain city.
- Voronoi diagrams together with farthest-point Voronoi diagrams are used for efficient algorithms to compute the roundness while assessing the dataset from a coordinate-measuring machine.
- Zeroes of iterated derivatives of a rational function on the complex plane accumulate on the edges of the Voronoi diagam of the set of the poles (Pólya's shires theorem[38]).
Informatics
- In networking, Voronoi diagrams can be used in derivations of the capacity of a wireless network.
- In computer graphics, Voronoi diagrams are used to calculate 3D shattering / fracturing geometry patterns. It is also used to procedurally generate organic or lava-looking textures.
- In autonomous robot navigation, Voronoi diagrams are used to find clear routes. If the points are obstacles, then the edges of the graph will be the routes furthest from obstacles (and theoretically any collisions).
- In 1-NN classifications.[39]
- In global scene reconstruction, including with random sensor sites and unsteady wake flow, geophysical data, and 3D turbulence data, Voronoi tesselations are used with deep learning.[40]
- In user interface development, Voronoi patterns can be used to compute the best hover state for a given point.[41]
Civics and planning
- In Melbourne, government school students are always eligible to attend the nearest primary school or high school to where they live, as measured by a straight-line distance. The map of school zones is therefore a Voronoi diagram.[42]
Bakery
- Ukrainian pastry chef Dinara Kasko uses the mathematical principles of the Voronoi diagram to create silicone molds made with a 3D printer to shape her original cakes.[43]
Algorithms
Several efficient algorithms are known for constructing Voronoi diagrams, either directly (as the diagram itself) or indirectly by starting with a Delaunay triangulation and then obtaining its dual. Direct algorithms include Fortune's algorithm, an O(n log(n)) algorithm for generating a Voronoi diagram from a set of points in a plane. Bowyer–Watson algorithm, an O(n log(n)) to O(n2) algorithm for generating a Delaunay triangulation in any number of dimensions, can be used in an indirect algorithm for the Voronoi diagram. The Jump Flooding Algorithm can generate approximate Voronoi diagrams in constant time and is suited for use on commodity graphics hardware.[44][45]
Lloyd's algorithm and its generalization via the Linde–Buzo–Gray algorithm (aka k-means clustering), use the construction of Voronoi diagrams as a subroutine. These methods alternate between steps in which one constructs the Voronoi diagram for a set of seed points, and steps in which the seed points are moved to new locations that are more central within their cells. These methods can be used in spaces of arbitrary dimension to iteratively converge towards a specialized form of the Voronoi diagram, called a Centroidal Voronoi tessellation, where the sites have been moved to points that are also the geometric centers of their cells.
Voronoi in 3D
Voronoi meshes can also be generated in 3D.
-
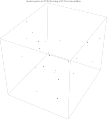 Random points in 3D for forming a 3D Voronoi partition
 -
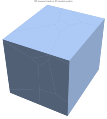 3D Voronoi mesh of 25 random points
 -
 3D Voronoi mesh of 25 random points with 0.3 opacity and points
 -
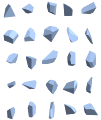 3D Voronoi mesh of 25 random points convex polyhedra pieces


See also
Notes
- ISBN 978-0-19-874284-5.
- ISBN 978-0-470-87001-3.
- ISBN 978-3-319-41758-5.
- S2CID 4613674.
- ISBN 978-0-471-98635-5.
- ^ Boyd, Stephen; Vandenberghe, Lieven (2004). Convex Optimization. Exercise 2.9: Cambridge University Press. p. 60.
{{cite book}}: CS1 maint: location (link) - ISBN 9783642037214.
- ^ Reem 2009.
- ^ Reem 2011.
- PMID 17806355.
- ^ Voronoï 1908a and Voronoï 1908b.
- ^ ISBN 978-3-540-77974-2. 7.4 Farthest-Point Voronoi Diagrams. Includes a description of the algorithm.
- ., contains a simple algorithm to compute the farthest-point Voronoi diagram.
- ^ Biedl, Therese; Grimm, Carsten; Palios, Leonidas; Shewchuk, Jonathan; Verdonschot, Sander (2016). "Realizing farthest-point Voronoi diagrams". Proceedings of the 28th Canadian Conference on Computational Geometry (CCCG 2016).
- ISBN 9783642615689.
- S2CID 1727373.
- ^ Hölscher, Tonio; Krömker, Susanne; Mara, Hubert (2020). "Der Kopf Sabouroff in Berlin: Zwischen archäologischer Beobachtung und geometrischer Vermessung". Gedenkschrift für Georgios Despinis (in German). Athens, Greece: Benaki Museum.
- YouTube. Analysis using the GigaMesh Software Framework as described by Hölscher et al. cf. doi:10.11588/heidok.00027985.
- ISBN 978-0-691-13903-6.
- S2CID 16074264.
- S2CID 1505014.
- ^ PMID 26598531.
- S2CID 232338911. Retrieved 2021-04-23.
- S2CID 119241866.
- S2CID 13326345.
- ISBN 978-1-101-15853-1. Retrieved 16 October 2017.
- PMID 9982595.
- PMID 24660052.
- S2CID 120017577.
- S2CID 13719907.
- S2CID 119443529.
- ^ "GOLD COAST CULTURAL PRECINCT". ARM Architecture. Archived from the original on 2016-07-07. Retrieved 2014-04-28.
- ^ Lopez, C.; Zhao, C.-L.; Magniol, S; Chiabaut, N; Leclercq, L (28 February 2019). "Microscopic Simulation of Cruising for Parking of Trucks as a Measure to Manage Freight Loading Zone". Sustainability. 11 (5), 1276.
- S2CID 202213370.
- S2CID 67908628.
- S2CID 2022860.
- S2CID 232071627.
- ^ Pólya, G. On the zeros of the derivatives of a function and its analytic character. Bulletin of the AMS, Volume 49, Issue 3, 178-191, 1943.
- ISBN 978-0-07-042807-2.
- ^ Shenwai, Tanushree (2021-11-18). "A Novel Deep Learning Technique That Rebuilds Global Fields Without Using Organized Sensor Data". MarkTechPost. Retrieved 2021-12-05.
- ^ Archived at Ghostarchive and the Wayback Machine: "Mark DiMarco: User Interface Algorithms [JSConf2014]" – via www.youtube.com.
- ^ "Find my School". Victorian Government Department of Education. Retrieved 2023-07-25.
- ^ Haridy, Rich (2017-09-06). "Architect turned cake-maker serves up mouth-watering geometric 3D-printed cakes". New Atlas.
- ISBN 1-59593-295-X.
- ^ "Shadertoy".
References
- ISBN 978-9814447638.
- .
- de Berg, Mark; van Kreveld, Marc; ISBN 978-3-540-65620-3. Includes a description of Fortune's algorithm.
- Klein, Rolf (1988). "Abstract voronoi diagrams and their applications: Extended abstract". Computational Geometry and its Applications. ISBN 978-3-540-52055-9.
- S2CID 199546675.
- Okabe, Atsuyuki; Boots, Barry; ISBN 0-471-98635-6.
- Reem, Daniel (2009). "An algorithm for computing Voronoi diagrams of general generators in general normed spaces". Proceedings of the Sixth International Symposium on Voronoi Diagrams in Science and Engineering (ISVD 2009). pp. 144–152. ISBN 978-1-4244-4769-5.
- Reem, Daniel (2011). "The Geometric Stability of Voronoi Diagrams with Respect to Small Changes of the Sites". Proceedings of the twenty-seventh annual symposium on Computational geometry. pp. 254–263. S2CID 14639512.
- .
- Voronoï, Georges (1908a). "Nouvelles applications des paramètres continus à la théorie des formes quadratiques. Premier mémoire. Sur quelques propriétés des formes quadratiques positives parfaites" (PDF). Journal für die Reine und Angewandte Mathematik. 1908 (133): 97–178. S2CID 116775758.
- Voronoï, Georges (1908b). "Nouvelles applications des paramètres continus à la théorie des formes quadratiques. Deuxième mémoire. Recherches sur les parallélloèdres primitifs" (PDF). Journal für die Reine und Angewandte Mathematik. 1908 (134): 198–287. S2CID 118441072.
- Watson, David F. (1981). "Computing the n-dimensional Delaunay tessellation with application to Voronoi polytopes". .
External links
- Weisstein, Eric W. "Voronoi diagram". MathWorld.
- Voronoi Diagrams in CGAL, the Computational Geometry Algorithms Library
- Demo program for SFTessellation algorithm, which creates Voronoi diagram using a Steppe Fire Model
  | ||||||
| International | |
|---|---|
| National | |
| Other | |