
Climate of Minnesota

Winter in Minnesota is characterized by cold (below freezing) temperatures. Snow is the main form of winter precipitation, but freezing rain, sleet, and occasionally rain are all possible during the winter months. Common storm systems include Alberta clippers or Panhandle hooks; some of which develop into blizzards. Annual snowfall extremes have ranged from over 170 inches or 4.32 metres in the rugged Superior Highlands of the North Shore to as little as 5 inches or 0.13 metres in southern Minnesota. Temperatures as low as −60 °F or −51.1 °C have occurred during Minnesota winters. Spring is a time of major transition in Minnesota. Snowstorms are common early in the spring, but by late-spring as temperatures begin to moderate, the state can experience tornado outbreaks, a risk which diminishes but does not cease through the summer and into the autumn.
In summer, heat and humidity predominate in the south, while warm and less humid conditions are generally present in the north. These humid conditions initiate thunderstorm activity 30–40 days per year. Summer high temperatures in Minnesota average in the mid-80s F (30 °C) in the south to the upper-70s F (25 °C) in the north, with temperatures as hot as 114 °F (46 °C) possible. The
General climatology

Because of its location in North America, Minnesota experiences temperature extremes characteristic of a continental climate, with cold winters and mild to hot summers in the south and frigid winters and generally cool summers in the north.[2] Each season has distinctive upper air patterns which bring different weather conditions with them. The state is nearly 500 miles (805 km) from any large body of water (with the exception of Lake Superior), and temperatures and precipitation vary widely. It is far enough north to experience −60 °F (−51 °C) temperatures and blizzards during the winter months, but far enough south to have 114 °F or 45.6 °C temperatures and tornado outbreaks in the summer.[3] The 174 °F or 96.7 °C variation between Minnesota's highest and lowest temperature is the eleventh largest variation of any U.S. state, and 3rd largest of any state east of the Rocky Mountains behind North Dakota and South Dakota.[4]
Minnesota is far from major sources of
Lake Superior

Lake Superior moderates the climate of those parts of Minnesota's Arrowhead Region near the shore. The lake acts as a heat sink, keeping the state's North Shore area relatively cooler in the summer and warmer in the winter.[10] While this effect is marked near the lake, it does not reach very far inland. For example, Grand Marais on the lakeshore has an average July high temperature of 70 °F (21 °C), while Virginia, at about the same latitude but inland about 100 miles (161 km) to the west, has an average July high of 77 °F (25 °C). Virginia's average high temperature in January is 15 °F (−9 °C), while Grand Marais’ is 23 °F (−5 °C). Just a few miles inland from Lake Superior are the Sawtooth Mountains, which almost completely confine the marine air masses and associated precipitation to lower elevations near the lake.[11]
The prevailing northwest winter winds also limit the lake's influence. Places near the shoreline can receive lake-effect snow, but because the state lies north and west of the lake, snowfall amounts are not nearly as large as they are in locations like Wisconsin and Michigan that lie downwind to the south.[9] Even so, the single largest snowstorm in Minnesota history was a lake effect event. On January 6, 1994, Finland, Minnesota, received 36 inches (0.91 m) of lake effect snow in 24 hours, and 47 inches (1.19 m) over a three-day period. Both are Minnesota records. At 85 inches or 2.16 metres per year, the port city of Duluth has the highest average snowfall total of any city in Minnesota.[12] At 58.9 °F (14.9 °C), Grand Marais has the lowest average summer temperature of any city in the state.[13]
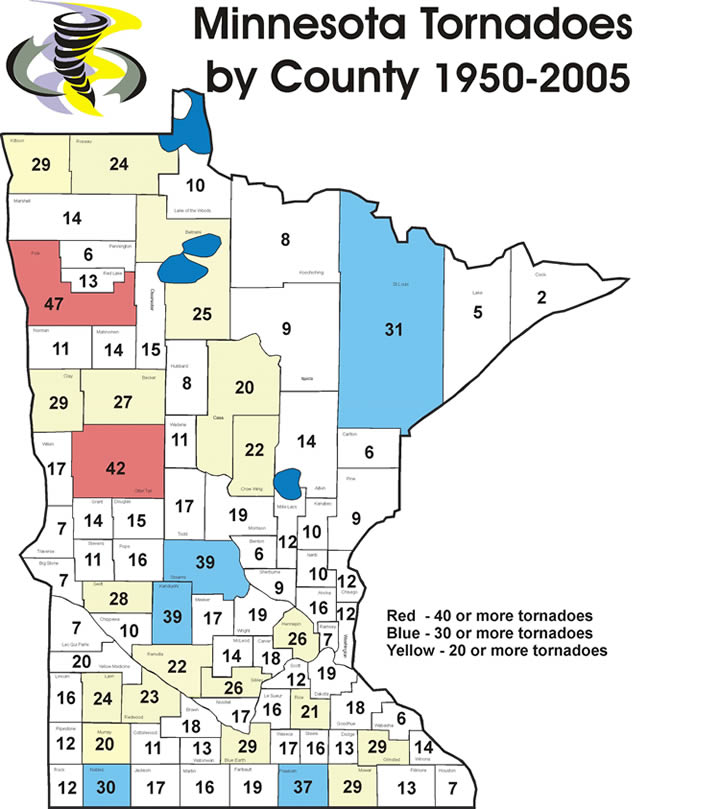
The climatological effects of Lake Superior tend to stifle convection, thus limiting the potential for tornadoes.[8] Although Cook and Lake counties are two of the largest counties in the state, they have experienced only seven tornadoes in the past 56 years.[14] One of those tornadoes was a large F3 that occurred in the Tornado outbreak of August 6, 1969.
Climate

Temperature
| Jan | Feb | Mar | Apr | May | Jun | Jul | Aug | Sept | Oct | Nov | Dec | Annual | |
|---|---|---|---|---|---|---|---|---|---|---|---|---|---|
| Alexandria[15] | 8 (−13) |
15 (−9) |
27 (−3) |
43 (6) |
56 (13) |
65 (18) |
70 (21) |
68 (20) |
58 (14) |
45 (7) |
28 (−2) |
14 (−10) |
41 (5) |
| Brainerd[16] | 6 (−14) |
13 (−11) |
26 (−3) |
42 (6) |
56 (13) |
64 (18) |
69 (21) |
66 (19) |
56 (13) |
44 (7) |
28 (−2) |
13 (−11) |
40 (4) |
| Duluth[17] | 10 (−12) |
17 (−8) |
26 (−3) |
39 (4) |
48 (9) |
58 (14) |
66 (19) |
65 (18) |
56 (13) |
45 (7) |
31 (−1) |
17 (−8) |
40 (4) |
| Grand Marais[18] | 14 (−10) |
19 (−7) |
28 (−2) |
38 (3) |
47 (8) |
53 (12) |
61 (16) |
63 (17) |
55 (13) |
45 (7) |
32 (0) |
19 (−7) |
39 (4) |
| International Falls[19] | 3 (−16) |
11 (−12) |
24 (−4) |
39 (4) |
53 (12) |
62 (17) |
66 (19) |
64 (18) |
53 (12) |
42 (6) |
24 (−4) |
9 (−13) |
38 (3) |
| Redwood Falls[20] | 13 (−11) |
20 (−7) |
32 (0) |
47 (8) |
60 (16) |
70 (21) |
74 (23) |
71 (22) |
62 (17) |
49 (9) |
32 (0) |
18 (−8) |
46 (8) |
| Thief River Falls[21] | 3 (−16) |
11 (−12) |
24 (−4) |
42 (6) |
56 (13) |
64 (18) |
69 (21) |
67 (19) |
56 (13) |
44 (7) |
24 (−4) |
9 (−13) |
39 (4) |
| Twin Cities[22] | 13 (−11) |
20 (−7) |
32 (0) |
47 (8) |
59 (15) |
68 (20) |
73 (23) |
71 (22) |
61 (16) |
49 (9) |
32 (0) |
19 (−7) |
45 (7) |
| Winona[23] | 18 (−8) |
24 (−4) |
36 (2) |
50 (10) |
62 (17) |
71 (22) |
76 (24) |
73 (23) |
64 (18) |
52 (11) |
32 (0) |
23 (−5) |
49 (9) |
| Worthington[24] | 11 (−12) |
18 (−8) |
29 (−2) |
44 (7) |
57 (14) |
67 (19) |
71 (22) |
68 (20) |
59 (15) |
47 (8) |
30 (−1) |
17 (−8) |
43 (6) |
Precipitation
| Jan | Feb | Mar | Apr | May | Jun | Jul | Aug | Sept | Oct | Nov | Dec | Annual | |
|---|---|---|---|---|---|---|---|---|---|---|---|---|---|
| Alexandria[15] | 1.0 (25) | 0.7 (18) | 1.5 (38) | 3.0 (76) | 4.5 (110) | 3.3 (84) | 3.6 (91) | 2.7 (69) | 2.2 (56) | 1.2 (30) | 0.6 (15) | 26.0 (660) | |
| Brainerd[16] | 0.8 (20) | 0.6 (15) | 1.5 (38) | 2.0 (51) | 3.3 (84) | 4.2 (110) | 4.1 (100) | 3.6 (91) | 2.8 (71) | 2.5 (64) | 1.6 (41) | 0.7 (18) | 27.7 (700) |
| Duluth[17] | 1.0 (25) | 0.5 (13) | 1.4 (36) | 1.6 (41) | 2.3 (58) | 3.7 (94) | 3.7 (94) | 3.7 (94) | 3.7 (94) | 1.9 (48) | 1.4 (36) | 0.8 (20) | 25.6 (650) |
| Grand Marais[18] | 0.7 (18) | 0.6 (15) | 1.1 (28) | 1.3 (33) | 2.5 (64) | 3.4 (86) | 3.4 (86) | 3.1 (79) | 3.4 (86) | 2.6 (66) | 1.8 (46) | 0.8 (20) | 24.6 (620) |
| International Falls[19] | 0.8 (20) | 0.6 (15) | 1.0 (25) | 1.4 (36) | 2.6 (66) | 4.0 (100) | 3.4 (86) | 3.1 (79) | 3.0 (76) | 2.0 (51) | 1.4 (36) | 0.7 (18) | 23.9 (610) |
| Redwood Falls[20] | 0.7 (18) | 0.6 (15) | 1.7 (43) | 2.5 (64) | 3.1 (79) | 4.1 (100) | 3.8 (97) | 3.6 (91) | 2.5 (64) | 1.9 (48) | 1.6 (41) | 0.6 (15) | 26.6 (680) |
| Thief River Falls[21] | 0.2 (5.1) | 0.3 (7.6) | 0.4 (10) | 1.0 (25) | 2.6 (66) | 3.4 (86) | 3.4 (86) | 3.1 (79) | 2.4 (61) | 1.7 (43) | 0.9 (23) | 0.3 (7.6) | 19.7 (500) |
| Twin Cities[22] | 1.0 (25) | 0.8 (20) | 1.9 (48) | 2.3 (58) | 3.2 (81) | 4.3 (110) | 4.1 (100) | 4.1 (100) | 2.7 (69) | 2.1 (53) | 1.9 (48) | 1.0 (25) | 29.4 (750) |
| Winona[23] | 1.4 (36) | 0.7 (18) | 1.8 (46) | 3.5 (89) | 3.9 (99) | 4.2 (110) | 4.4 (110) | 4.7 (120) | 3.9 (99) | 2.2 (56) | 2.2 (56) | 1.3 (33) | 34.2 (870) |
| Worthington[24] | 0.7 (18) | 0.6 (15) | 1.9 (48) | 2.7 (69) | 3.4 (86) | 4.6 (120) | 3.6 (91) | 3.5 (89) | 2.6 (66) | 2.0 (51) | 1.7 (43) | 0.7 (18) | 27.8 (710) |
Full statistics for selected cities 1981–2010
| Climate data for Duluth Int'l, Minnesota (1991–2020 normals,[a] extremes 1871–present[b]) | |||||||||||||
|---|---|---|---|---|---|---|---|---|---|---|---|---|---|
| Month | Jan | Feb | Mar | Apr | May | Jun | Jul | Aug | Sep | Oct | Nov | Dec | Year |
| Record high °F (°C) | 55 (13) |
58 (14) |
81 (27) |
88 (31) |
95 (35) |
97 (36) |
106 (41) |
97 (36) |
97 (36) |
86 (30) |
75 (24) |
56 (13) |
106 (41) |
| Mean maximum °F (°C) | 38.6 (3.7) |
43.0 (6.1) |
55.9 (13.3) |
70.7 (21.5) |
81.7 (27.6) |
86.0 (30.0) |
88.6 (31.4) |
86.7 (30.4) |
81.9 (27.7) |
74.0 (23.3) |
55.4 (13.0) |
40.3 (4.6) |
90.2 (32.3) |
| Mean daily maximum °F (°C) | 19.9 (−6.7) |
24.8 (−4.0) |
36.2 (2.3) |
49.2 (9.6) |
63.0 (17.2) |
72.1 (22.3) |
77.7 (25.4) |
75.8 (24.3) |
67.2 (19.6) |
52.7 (11.5) |
37.1 (2.8) |
24.7 (−4.1) |
50.0 (10.0) |
| Daily mean °F (°C) | 11.2 (−11.6) |
15.4 (−9.2) |
27.0 (−2.8) |
39.5 (4.2) |
52.0 (11.1) |
61.2 (16.2) |
67.0 (19.4) |
65.5 (18.6) |
57.2 (14.0) |
44.1 (6.7) |
29.8 (−1.2) |
17.1 (−8.3) |
40.6 (4.8) |
| Mean daily minimum °F (°C) | 2.4 (−16.4) |
6.0 (−14.4) |
17.8 (−7.9) |
29.9 (−1.2) |
41.0 (5.0) |
50.2 (10.1) |
56.2 (13.4) |
55.2 (12.9) |
47.3 (8.5) |
35.6 (2.0) |
22.5 (−5.3) |
9.6 (−12.4) |
31.1 (−0.5) |
| Mean minimum °F (°C) | −21.9 (−29.9) |
−17.3 (−27.4) |
−7.4 (−21.9) |
14.7 (−9.6) |
28.7 (−1.8) |
38.1 (3.4) |
45.7 (7.6) |
44.6 (7.0) |
32.5 (0.3) |
21.9 (−5.6) |
2.7 (−16.3) |
−14.3 (−25.7) |
−23.9 (−31.1) |
| Record low °F (°C) | −41 (−41) |
−39 (−39) |
−29 (−34) |
−5 (−21) |
16 (−9) |
27 (−3) |
35 (2) |
32 (0) |
23 (−5) |
6 (−14) |
−29 (−34) |
−35 (−37) |
−41 (−41) |
| Average precipitation inches (mm) | 0.95 (24) |
1.01 (26) |
1.46 (37) |
2.53 (64) |
3.37 (86) |
4.39 (112) |
3.92 (100) |
3.73 (95) |
3.48 (88) |
2.91 (74) |
1.96 (50) |
1.47 (37) |
31.18 (792) |
| Average snowfall inches (cm) | 16.8 (43) |
15.1 (38) |
12.8 (33) |
9.1 (23) |
0.8 (2.0) |
0.0 (0.0) |
0.0 (0.0) |
0.0 (0.0) |
0.1 (0.25) |
2.7 (6.9) |
14.1 (36) |
18.7 (47) |
90.2 (229) |
| Average extreme snow depth inches (cm) | 18.6 (47) |
20.3 (52) |
19.4 (49) |
8.2 (21) |
0.4 (1.0) |
0.0 (0.0) |
0.0 (0.0) |
0.0 (0.0) |
0.0 (0.0) |
1.2 (3.0) |
6.6 (17) |
12.7 (32) |
24.8 (63) |
| Average precipitation days (≥ 0.01 in) | 10.4 | 8.9 | 9.6 | 11.3 | 12.7 | 12.4 | 11.9 | 10.8 | 11.6 | 11.9 | 11.0 | 10.7 | 133.2 |
| Average snowy days (≥ 0.1 in) | 13.1 | 10.9 | 8.0 | 5.7 | 0.6 | 0.0 | 0.0 | 0.0 | 0.1 | 2.1 | 9.0 | 12.9 | 62.4 |
| Average relative humidity (%)
|
72.0 | 69.8 | 69.3 | 63.6 | 62.7 | 69.5 | 70.9 | 74.5 | 75.7 | 71.4 | 74.9 | 76.3 | 70.9 |
| Average dew point °F (°C) | 0.3 (−17.6) |
4.5 (−15.3) |
15.4 (−9.2) |
25.5 (−3.6) |
36.5 (2.5) |
48.2 (9.0) |
55.0 (12.8) |
54.0 (12.2) |
45.7 (7.6) |
34.0 (1.1) |
21.2 (−6.0) |
7.2 (−13.8) |
29.0 (−1.7) |
| Mean monthly sunshine hours | 132.7 | 149.7 | 190.7 | 229.5 | 263.5 | 272.8 | 307.5 | 261.8 | 194.0 | 150.4 | 98.5 | 102.3 | 2,353.4 |
| Percent possible sunshine | 47 | 52 | 52 | 56 | 57 | 58 | 64 | 60 | 51 | 44 | 35 | 38 | 53 |
| Source: | |||||||||||||
| Climate data for Minneapolis–Saint Paul International Airport, Minnesota (1991–2020 normals,[c] extremes 1872–present)[d] | |||||||||||||
|---|---|---|---|---|---|---|---|---|---|---|---|---|---|
| Month | Jan | Feb | Mar | Apr | May | Jun | Jul | Aug | Sep | Oct | Nov | Dec | Year |
| Record high °F (°C) | 58 (14) |
65 (18) |
83 (28) |
95 (35) |
106 (41) |
104 (40) |
108 (42) |
103 (39) |
104 (40) |
92 (33) |
77 (25) |
68 (20) |
108 (42) |
| Mean maximum °F (°C) | 42.5 (5.8) |
46.7 (8.2) |
64.7 (18.2) |
79.7 (26.5) |
88.7 (31.5) |
93.3 (34.1) |
94.4 (34.7) |
91.7 (33.2) |
88.3 (31.3) |
80.1 (26.7) |
62.1 (16.7) |
47.1 (8.4) |
96.4 (35.8) |
| Mean daily maximum °F (°C) | 23.6 (−4.7) |
28.5 (−1.9) |
41.7 (5.4) |
56.6 (13.7) |
69.2 (20.7) |
79.0 (26.1) |
83.4 (28.6) |
80.7 (27.1) |
72.9 (22.7) |
58.1 (14.5) |
41.9 (5.5) |
28.8 (−1.8) |
55.4 (13.0) |
| Daily mean °F (°C) | 16.2 (−8.8) |
20.6 (−6.3) |
33.3 (0.7) |
47.1 (8.4) |
59.5 (15.3) |
69.7 (20.9) |
74.3 (23.5) |
71.8 (22.1) |
63.5 (17.5) |
49.5 (9.7) |
34.8 (1.6) |
22.0 (−5.6) |
46.9 (8.3) |
| Mean daily minimum °F (°C) | 8.8 (−12.9) |
12.7 (−10.7) |
24.9 (−3.9) |
37.5 (3.1) |
49.9 (9.9) |
60.4 (15.8) |
65.3 (18.5) |
62.8 (17.1) |
54.2 (12.3) |
40.9 (4.9) |
27.7 (−2.4) |
15.2 (−9.3) |
38.4 (3.6) |
| Mean minimum °F (°C) | −14.7 (−25.9) |
−8 (−22) |
2.7 (−16.3) |
21.9 (−5.6) |
35.7 (2.1) |
47.3 (8.5) |
54.5 (12.5) |
52.3 (11.3) |
38.2 (3.4) |
26.0 (−3.3) |
9.2 (−12.7) |
−7.1 (−21.7) |
−16.9 (−27.2) |
| Record low °F (°C) | −41 (−41) |
−33 (−36) |
−32 (−36) |
2 (−17) |
18 (−8) |
34 (1) |
43 (6) |
39 (4) |
26 (−3) |
10 (−12) |
−25 (−32) |
−39 (−39) |
−41 (−41) |
| Average precipitation inches (mm) | 0.89 (23) |
0.87 (22) |
1.68 (43) |
2.91 (74) |
3.91 (99) |
4.58 (116) |
4.06 (103) |
4.34 (110) |
3.02 (77) |
2.58 (66) |
1.61 (41) |
1.17 (30) |
31.62 (803) |
| Average snowfall inches (cm) | 11.0 (28) |
9.5 (24) |
8.2 (21) |
3.5 (8.9) |
0.0 (0.0) |
0.0 (0.0) |
0.0 (0.0) |
0.0 (0.0) |
0.0 (0.0) |
0.8 (2.0) |
6.8 (17) |
11.4 (29) |
51.2 (130) |
| Average extreme snow depth inches (cm) | 8 (20) |
9 (23) |
8 (20) |
2 (5.1) |
0 (0) |
0 (0) |
0 (0) |
0 (0) |
0 (0) |
0 (0) |
4 (10) |
7 (18) |
9 (23) |
| Average precipitation days (≥ 0.01 in) | 9.6 | 7.8 | 9.0 | 11.2 | 12.4 | 11.8 | 10.4 | 9.8 | 9.3 | 9.5 | 8.3 | 9.7 | 118.8 |
| Average snowy days (≥ 0.1 in) | 9.3 | 7.3 | 5.2 | 2.4 | 0.1 | 0.0 | 0.0 | 0.0 | 0.0 | 0.6 | 4.5 | 8.8 | 38.2 |
| Average relative humidity (%)
|
69.9 | 69.5 | 67.4 | 60.3 | 60.4 | 63.8 | 64.8 | 67.9 | 70.7 | 68.3 | 72.6 | 74.1 | 67.5 |
| Average dew point °F (°C) | 4.1 (−15.5) |
9.5 (−12.5) |
20.7 (−6.3) |
31.6 (−0.2) |
43.5 (6.4) |
54.7 (12.6) |
60.1 (15.6) |
58.3 (14.6) |
49.8 (9.9) |
37.9 (3.3) |
25.0 (−3.9) |
11.1 (−11.6) |
33.9 (1.0) |
| Mean monthly sunshine hours | 156.7 | 178.3 | 217.5 | 242.1 | 295.2 | 321.9 | 350.5 | 307.2 | 233.2 | 181.0 | 112.8 | 114.3 | 2,710.7 |
| Percent possible sunshine | 55 | 61 | 59 | 60 | 64 | 69 | 74 | 71 | 62 | 53 | 39 | 42 | 59 |
| Average ultraviolet index | 1 | 2 | 3 | 5 | 7 | 8 | 8 | 7 | 5 | 3 | 2 | 1 | 4 |
| Source 1: | |||||||||||||
| Source 2: Weather Atlas (UV)[32] | |||||||||||||
Seasons
Winter

Even though winter does not officially start until late December, Minnesota usually begins experiencing winter-like conditions in November, sometimes in October. As with many other Midwestern states, winter in Minnesota is characterized by cold (below freezing) temperatures and snowfall. Weather systems can move in from the north, west, or south, with the majority of the weather being driven in from the north. A vigorous jet stream brings high and low-pressure systems through in quick succession, which can cause large temperature variations over a short period of time.
Winter temperature
As the last remnants of summertime air in the
Winter precipitation
Winter precipitation comes in a few different forms. Snow is the main form of precipitation, but freezing rain, ice, sleet and sometimes even rain are all possible during the winter months. Larger storm systems, often Panhandle hooks or other storms that occur with a
Alberta clippers
Panhandle hooks
In terms of their characteristics, Panhandle hooks are nearly the opposite of Alberta clippers. Instead of forming in the north and dropping south, these low pressure systems form in the
Spring

As spring progresses, the jet stream starts to push storm systems farther to the north, and southern Minnesota becomes more prone to severe thunderstorms and tornadoes.[46] As spring moves into the later stages, the chances for snow continue to drop and eventually disappear, south to north. By the time it gets warm enough for severe weather in northern Minnesota, the strength of storm systems have usually started to decrease, which results in fewer severe storms in northern Minnesota compared to the southern part of the state.
Wind
With the exception of areas along the shores of Lake Superior, winds in Minnesota generally prevail from the north and northwest in the winter, and south and southeast in the summer.
Floods

Minnesota is prone to flooding in its major rivers by spring snowmelt runoff and ice jams. Spring flooding to some degree occurs almost annually on some Minnesota rivers, but major floods have occurred in 1965, 1969, 1997, 2001, and 2009.[50][51] The flooding in 1965 was the worst flood in Minnesota history on the Mississippi River, while the flooding in 1997 was the worst in history on the Red River.[52] The Red River flood of 1997 was aided heavily by the 11 blizzards that struck Minnesota that winter.[8][53] Besides heavy winter and spring snowfall, cold winter temperatures and heavy autumn and spring rains causing sudden run-off surges are also common causes of spring river flooding in Minnesota.[54]
Minnesota is also prone to both river flooding and localized flash flooding by extended periods of heavy late-spring and summer rainfall. The Great Flood of 1993 on the Mississippi River was caused by copious amounts of rain that fell after the spring snow melt.[55]
The
Summer
During a Minnesota summer, heat and humidity predominate in the south, while warm and less humid conditions are generally present in the north. A main feature of summer weather in Minnesota and the Midwestern United States as a whole is the weakening of the jet stream, leading to slower movement of air masses, a general increase in the stability of temperatures, and less wind.[58] The strong wind that does blow almost always comes from the south, bringing in warm temperatures and humidity. These humid conditions and a jet stream that has pushed into the northern parts of the U.S. initiate thunderstorm activity 30–40 days per year.[59]
Temperature

Daily average summer temperatures in Minnesota range from the low 70s (22 °C) in the south to the mid 60s °F (19 °C) in the north.[13] Because summer time air masses are not as volatile as in the winter, daily high and low temperatures rarely vary more than 15 degrees (7 °C) either side of normal. While summertime around much of the country means long stretches of hot and humid weather, Minnesota is located far enough north where periods of cooler, drier polar air frequently move in behind polar fronts dropping south from Canada.[7] The polar air typically does not linger very long however and is quickly replaced by the warmer and more humid air from the Gulf of Mexico again. The cool, dry polar air colliding with hot and humid summertime air keep the threat of thunderstorms and tornadoes in Minnesota through July and August.[46] Northern Minnesota is considerably cooler and less humid than southern Minnesota during the summer months. For example, Duluth's annual average temperature and dew point are 6 degrees (3.4 °C) cooler than Minneapolis'.[60]
July is the hottest month in Minnesota statewide and is usually the month when the peak heat waves occur. In July 1936, Minnesota and the rest of the Midwest suffered through its most severe heat wave on record. Most of the state was engulfed in 100 °F (37.8 °C) temperatures for several days in a row, and Minnesota's all-time record high temperature of 114 °F or 45.6 °C was equaled during this stretch. This heat wave was also responsible for the Twin Cities' all-time record high of 108 °F or 42.2 °C, as well as the all-time record high of several other cities across the state.[61]
The western region of Minnesota experiences the hottest summer temperatures. Coteau des Prairies can heat cities to the north of it similar to how places in the Rocky Mountains are warmed by Chinook winds. As southwest winds blow down the slope of Coteau des Prairies, the air compresses and warms. This heats the hot air even further and often brings locations such as Beardsley and Moorhead the hottest temperatures in the state, despite their higher latitudes.[7]
Precipitation
Summertime thunderstorms are fueled by dew points that often reach beyond 70 °F (21.1 °C) and sometimes even 80 °F or 26.7 °C.[64] In addition to severe conditions, thunderstorms produce heavy rain and cloud to ground lightning. Heavy rain brings flash floods to Minnesota an average of three days per year.[33] With the exception of hail, summer precipitation in Minnesota is almost always in the form of rain. The lone exception is in far northern Minnesota, where in mid-September, small amounts of snow become a possibility.[8]
Droughts

Other memorable drought years were 1976 and the
Tornadoes
- August 21, 1883: An F5 tornado struck Rochester, killing 37. This tornado led to the construction of a new hospital, which eventually evolved into the Mayo Clinic.
- April 14, 1886: A large tornado struck Sauk Rapids, killing 72. This was Minnesota's deadliest tornado on record.[69]
- June 22, 1919: The second-deadliest tornado in Minnesota history tore through Fergus Falls, killing 59.
- May 6, 1965: Four F4 tornadoes ripped through the Twin Cities metro area (two of them in Fridley), killing 13.
- June 16, 1992: Minnesota experienced its second-largest tornado outbreak with 27 recorded twisters. The largest tornado in this family was an F5 that struck Chandler, Minnesota, killing one. This is the most recent F5 tornado to strike the state.
- March 29, 1998: An F4 and an F3 tornado that were part of a larger outbreak tore through the towns of Comfrey and St. Peter. They killed two and caused damage in the millions of dollars in Minnesota's earliest recorded tornado outbreak.
- June 17, 2010: Three EF4 and six EF3 tornadoes were part of 48 twisters that touched down in Minnesota's largest tornado outbreak on record.[46]
Autumn

Autumn weather in Minnesota is marked by the rapid decrease of severe thunderstorms, dramatic cooling, and eventually the possibility of blizzards. With summer-time heat still prevalent in the southern U.S. and colder air quickly taking hold in Canada, Minnesota can be affected by wide temperature swings in short periods of time. Because of this, the jet stream, which tends to weaken during the summer months, begins to re-strengthen. This leads to quicker changes in weather patterns and increasingly strong storm systems.[70][71] As autumn moves on, these storm systems bring with them progressively colder air, eventually changing the rain over snow, generally starting in October in the northern part of the state and November in the south.[72] From September to December the average temperature in the state falls by approximately 43 °F (23 °C), the largest such temperature swing within any Minnesota season.[13]
Climate change
This article contains too many or overly lengthy quotations. (May 2022) |

Climate change in Minnesota encompasses the effects of climate change, attributed to human-caused increases in atmospheric carbon dioxide, in the U.S. state of Minnesota.
The United States Environmental Protection Agency has reported that "Minnesota's climate is changing. The state has warmed one to three degrees (F) in the 20th century. Floods are becoming more frequent, and ice cover on lakes is forming later and melting sooner. In the coming decades, these trends are likely to continue. Rising temperatures may interfere with winter recreation, extend the growing season, change the composition of trees in the North Woods, and increase water pollution problems in lakes and rivers. The state will have more extremely hot days, which may harm public health in urban areas and corn harvests in rural areas".[77]
A 2015 Minnesota Public Radio (MPR) News report describing various indicators that the climate of Minnesota was changing noted specific regional trends of increasing temperatures and precipitation, and effects on trees and wildlife.[78]Image and popular culture
Minnesota's climate has done much to shape the image of the state. Minnesota has a late but intense spring, a summer of water sports, an autumn of brilliantly colored leaves, and a long winter with outdoor sports and activities.
"Summer at the lake" is a Minnesota tradition. Water skiing was invented in Minnesota by Ralph Samuelson, and the Minneapolis Aquatennial features a milk carton boat race. Contestants build boats from milk cartons and float them on Minneapolis area lakes, with recognition based more on colorful and imaginative designs than on actual racing performance.[79]
But while Minnesota's warm summers provide its natives and tourists with a variety of outdoor activities, the state is known for its winters. The state has produced curlers, skiers, and lugers who have competed in the Winter Olympics, pioneers who invented the snowmobile, and legions of ice fishing enthusiasts.[80]

The state is also known for enthusiastic ice hockey players, both at the amateur and professional levels. Eveleth, Minnesota, home to the United States Hockey Hall of Fame, boasts of the number of quality players and the contributions of the city (and the rest of the Mesabi Range) to the growth and development of hockey in the United States.[81]
To many outsiders, Minnesota's winters appear to be cold and inhospitable. A World War II newscaster, in describing the brutally cold conditions of the Russian front, stated that at least Minnesotans could understand it.[80] A New York journalist visited St. Paul and declared that the city was "another Siberia, unfit for human habitation." In response, the city decided to build a huge ice palace in 1886, similar to one that Montreal had built in 1885. They hired the architects of the Canadian ice palace to design one for St. Paul and built a palace 106 ft (32.3 m) high with ice blocks cut from a nearby lake.[79] This began the tradition of the Saint Paul Winter Carnival, a ten-day festival which celebrates Minnesota's winter season.[82]
Minnesota's winters are the setting of several television programs and Hollywood films, including the 1996 film Fargo which features the backdrop of a Minnesota winter, but like most of the characters in the movie, the climate is portrayed as bleak and inhospitable.[83]
See also
Notes
- ^ Mean monthly maxima and minima (i.e. the expected highest and lowest temperature readings at any point during the year or given month) calculated based on data at said location from 1991 to 2020.
- ^ Official records for Duluth were kept at downtown from August 1871 to May 1941, and at Duluth Int'l since June 1941. For more information, see ThreadEx.
- ^ Mean monthly maxima and minima (i.e., the highest and lowest temperature readings during an entire month or year) calculated based on data at the said location from 1991 to 2020.
- ^ Official records for Minneapolis/Saint Paul were kept by the Saint Paul Signal Service in that city from January 1871 to December 1890, the Minneapolis Weather Bureau from January 1891 to April 8, 1938, and at Minneapolis–St. Paul International Airport (KMSP) since April 9, 1938.[28]
References
- ^ a b "Minnesota Tornado History and Statistics" Archived August 11, 2007, at the Wayback Machine, Minnesota Climatology Working Group, updated 05.28.2013, retrieved 10.28.2013
- NOAA. Archivedfrom the original on December 19, 2014. Retrieved November 10, 2006.
- ^ "Minnesota Climate Facts". Minnesota DNR. 2004. Archived from the original on October 8, 2006. Retrieved November 10, 2006.
- ^ "U.S. Extreme Record Temps & Differences". Golden Gate Weather Services. 2005. Archived from the original on October 1, 2012. Retrieved November 23, 2006.
- ^ Daly, Christopher (1990). "Annual Average Precipitation". Desert Research Institute. Archived from the original (JPG) on December 30, 2006. Retrieved November 10, 2006.
- ^ "Climate Extremes for Minnesota". Minnesota Climatology Office. September 8, 2004. Archived from the original on October 5, 2006. Retrieved November 10, 2006.
- ^ ISBN 978-1-56037-000-0.
- ^ ISBN 978-0-87351-554-2.
- ^ a b "superior pursuit: facts about the greatest great lake". Minnesota Sea Grant. Archived from the original on July 21, 2017. Retrieved June 1, 2007.
- ^ "Lake Superior Uplands". Minnesota DNR. Archived from the original on February 18, 2007. Retrieved February 25, 2007.
- ^ "Snowfall, 2005-11 – 2006-04". Minnesota Climatology Office. 2006. Archived from the original on December 7, 2006. Retrieved November 10, 2006.
- ^ "Climate Summaries". University of Illinois. Archived from the original on November 12, 2006. Retrieved November 10, 2006.
- ^ a b c Ross, Douglas. "U.S. Climate Normals". NCDC. Archived from the original on February 18, 2013. Retrieved November 10, 2006.
- ^ "Minnesota Tornadoes by County 1950–2005" (JPG). NOAA. 2005. Archived from the original on January 13, 2007. Retrieved November 26, 2006.
- ^ a b Ross, Douglas (1971–2000). "Daily Normals for Alexandria, Minnesota". NCDC. Archived from the original on June 22, 2011. Retrieved June 7, 2007.
- ^ a b Ross, Douglas (1971–2000). "Daily Normals for Brainerd, Minnesota". NCDC. Archived from the original on June 28, 2011. Retrieved December 27, 2007.
- ^ a b Ross, Douglas (1971–2000). "Daily Normals for Duluth, Minnesota". NCDC. Archived from the original on May 6, 2009. Retrieved June 7, 2007.
- ^ a b Ross, Douglas (1971–2000). "Daily Normals for Grand Marais, Minnesota". NCDC. Archived from the original on May 6, 2009. Retrieved December 27, 2007.
- ^ a b Ross, Douglas (1971–2000). "Daily Normals for International Falls, Minnesota". NCDC. Archived from the original on May 6, 2009. Retrieved June 7, 2007.
- ^ a b Ross, Douglas (1971–2000). "Daily Normals for Redwood Falls, Minnesota". NCDC. Archived from the original on June 28, 2011. Retrieved June 7, 2007.
- ^ a b Ross, Douglas (1971–2000). "Daily Normals for Thief River Falls, Minnesota". NCDC. Archived from the original on June 28, 2011. Retrieved June 7, 2007.
- ^ a b Ross, Douglas (1971–2000). "Daily Normals for the Twin Cities". NCDC. Archived from the original on September 5, 2009. Retrieved June 7, 2007.
- ^ a b Ross, Douglas (1971–2000). "Daily Normals for Winona, Minnesota". NCDC. Archived from the original on May 6, 2009. Retrieved June 7, 2007.
- ^ a b Ross, Douglas (1971–2000). "Daily Normals for Worthington, Minnesota". NCDC. Archived from the original on June 28, 2011. Retrieved June 7, 2007.
- ^ "NowData – NOAA Online Weather Data". National Oceanic and Atmospheric Administration. Retrieved June 22, 2021.
- ^ "Station: Duluth, MN". U.S. Climate Normals 2020: U.S. Monthly Climate Normals (1991–2020). National Oceanic and Atmospheric Administration. Retrieved June 22, 2021.
- ^ "WMO Climate Normals for DULUTH/WSO AP MN 1961–1990". National Oceanic and Atmospheric Administration. Retrieved June 22, 2021.
- ^ "Threaded Station Extremes (Long-Term Station Extremes for America)". US National Centers for Environmental Information, US National Weather Service, and Regional Climate Centers. Archived from the original on May 19, 2006. Retrieved May 1, 2023.
- ^ "NowData – NOAA Online Weather Data". US National Weather Service, US National Oceanic and Atmospheric Administration. Archived from the original on August 17, 2021. Retrieved June 17, 2021.
- ^ "Station: Minneapolis/St Paul AP, MN". U.S. Climate Normals 2020: U.S. Monthly Climate Normals (1991–2020). US National Weather Service, US National Oceanic and Atmospheric Administration. Archived from the original on December 20, 2021. Retrieved June 17, 2021.
- ^ "WMO climate normals for Minneapolis/INT'L ARPT, MN 1961–1990". US National Weather Service, US National Oceanic and Atmospheric Administration. Archived from the original on February 10, 2023. Retrieved July 18, 2020.
- ^ "Minneapolis, Minnesota, USA – Monthly weather forecast and Climate data". Weather Atlas. Ezoic. Archived from the original on June 27, 2019. Retrieved July 4, 2019.
- ^ a b c "Climate of Minnesota" (PDF). NCDC. Archived from the original (PDF) on September 29, 2006. Retrieved November 10, 2006.
- ^ Potter, Sean (August 10, 2006). "Icebox of the Nation". USA Today. Archived from the original on July 6, 2007. Retrieved November 10, 2006.
- ^ Best Places to Live in Rural America. Progressive Farmer's 2007 Annual Report. 2007.
- ^ Gianassca, Frank. "Zonal winds tend to bring calm weather". USA Today. Archived from the original on February 22, 2007. Retrieved December 3, 2006.
- ^ Palmer, Chad (November 1, 2007). "Meridional flow brings extreme weather to USA". USA Today. Archived from the original on January 26, 2008. Retrieved December 19, 2007.
- ^ Palmer, Chad. "Alberta Clippers reinforce cold air". USA Today. Archived from the original on September 13, 2006. Retrieved November 15, 2006.
- ^ Metcalfe, John (January 5, 2011). "Winter storm class: The Clipper with different names". abc2news.com. Archived from the original on January 15, 2011. Retrieved February 14, 2011.
- ^ Henson, Bob. "Alberta Clipper". The Weather Notebook. Archived from the original on February 19, 2015. Retrieved November 10, 2006.
- ^ ISBN 978-0-89658-208-8.
- ^ "Lake Effect Snow". The Weather Channel. Archived from the original on March 4, 2007. Retrieved December 8, 2006.
- ^ "Panhandle Hook". NOAA. Archived from the original on December 31, 2006. Retrieved November 15, 2006.
- ^ "Panhandle Hook". NOAA. Archived from the original on December 31, 2006. Retrieved December 3, 2006.
- ^ "Spring and Summer Bring Stormy Weather". National Center for Atmospheric Research. Archived from the original on February 21, 2007. Retrieved December 8, 2006.
- ^ a b c d "Minnesota Tornado History and Statistics". Minnesota Climatology Office. September 20, 2006. Archived from the original on August 11, 2007. Retrieved November 10, 2006.
- ^ "April Fool's Day Snowfall of 2002". Minnesota Climatology Office. April 2, 2002. Archived from the original on December 7, 2006. Retrieved November 10, 2006.
- ^ "Minnesota has more potential for wind energy". Associated Press. February 8, 2006. Retrieved November 10, 2006.[permanent dead link]
- ^ "Buffalo Ridge Wind Power Plant". Xcel Energy. Archived from the original on May 7, 2006. Retrieved November 2, 2006.
- ^ "Flood Information". Army Corps of Engineers. Archived from the original on September 15, 2001. Retrieved November 24, 2006.
- ^ "2007 Federal Disaster Declarations". FEMA. August 26, 2007. Archived from the original on August 30, 2007. Retrieved August 27, 2007.
- ^ "The Mississippi River Flood of 1965". NOAA. November 8, 2005. Archived from the original on December 10, 2006. Retrieved November 18, 2006.
- ^ "Famous Minnesota Winter Storms". Minnesota Climatology Office. December 10, 2001. Archived from the original on January 7, 2009. Retrieved November 24, 2006.
- ^ "Climatic Conditions Leading to the Spring Flooding of 2001". Minnesota Climatology Office. April 21, 2001. Archived from the original on December 7, 2006. Retrieved November 24, 2006.
- ^ Larson, Lee (June 28, 1996). "The Great USA Flood of 1993". NOAA. Archived from the original on January 26, 2012. Retrieved November 24, 2006.
- ^ "Heavy rains fall on southern Minnesota: August 18 – August 20". Minnesota Climatology Office. August 22, 2007. Archived from the original on May 26, 2011. Retrieved August 24, 2007.
- ^ "Significant Flooding and Heavy Rain of September 22-23, 2010". National Weather Service, La Crosse, Wisconsin office. September 27, 2010. Archived from the original on June 28, 2011. Retrieved March 9, 2011.
- ^ Cappella, Chris (December 3, 2003). "Typical speeds of jet stream winds". USA Today. Archived from the original on February 14, 2006. Retrieved November 10, 2006.
- ^ "U.S. Thunderstorm Distribution". NOAA. Archived from the original on October 15, 2006. Retrieved October 25, 2006.
- ^ "Air Temperatures & Dew Points – Great Lakes States". Minnesotans For Sustainability. Archived from the original on October 16, 2006. Retrieved November 10, 2006.
- Minneapolis Star Tribune. Archived from the originalon March 14, 2007. Retrieved November 10, 2006.
- ^ "Normal Precipitation Maps". Minnesota Climatology Office. November 13, 2003. Archived from the original on October 5, 2006. Retrieved November 10, 2006.
- ^ "The Boundary Waters-Canadian Derecho". NOAA. Archived from the original on February 7, 2006. Retrieved December 3, 2006.
- ^ "High Dew Point Temperatures". Minnesota Climatology Office. July 28, 2005. Archived from the original on February 8, 2007. Retrieved December 8, 2006.
- ^ "Drought of 1988" (PDF). Minnesota DNR. January 1989. Archived from the original (PDF) on December 11, 2006. Retrieved November 21, 2006.
- ^ "Timeline of the Dust Bowl". PBS. Archived from the original on March 7, 2012. Retrieved November 26, 2006.
- ^ "Monday, Oct. 14, 1918: Hundreds die in Cloquet fire". Minneapolis Star Tribune. November 11, 2005. Archived from the original on March 16, 2007. Retrieved November 26, 2006.
- ^ "Cavity Lake fire nearly history". Associated Press. August 6, 2006. Archived from the original on December 20, 2010. Retrieved November 26, 2006.
- ^ "Sauk Rapids History". City of Sauk Rapids. Archived from the original on February 16, 2007. Retrieved November 10, 2006.
- ^ "Jet Stream". University of Illinois. Archived from the original on November 6, 2018. Retrieved November 23, 2006.
- ^ "Local Climate Records". NOAA. Archived from the original on December 9, 2006. Retrieved November 23, 2006.
- ^ Boulay, Pete. "Hey How's the Weather? — July – August 2003". Minnesota State Climatology Office. Archived from the original on February 3, 2007. Retrieved January 22, 2007.
- ^ "Record Low Pressure Hits Minnesota October 26–27, 2010". Minnesota Climatology Working Group: University of Minnesota. October 26, 2010. Archived from the original on October 31, 2010. Retrieved October 27, 2010.
- ^ "Armistice Day Storm". NOAA. Archived from the original on December 10, 2006. Retrieved November 23, 2006.
- Minneapolis Star Tribune. Archived from the originalon September 20, 2006. Retrieved November 23, 2006.
- ^ "Top 5 weather events of the 20th Century". Minnesota Climatology Office. Archived from the original on December 7, 2006. Retrieved December 3, 2006.
- ^ "What Climate Change Means for Minnesota" (PDF). United States Environmental Protection Agency. August 2016.
- ^ "Climate Change in Minnesota: 23 signs". MPR News. February 2, 2015.
- ^ ISBN 978-1-4027-3908-8.
- ^ ISBN 978-0-393-04628-1.
- ^ "U.S. Hockey Hall of Fame". Archived from the original on December 18, 2020. Retrieved February 4, 2007.
- ^ "Winter Carnival: History". St. Paul Winter Carnival. Archived from the original on January 29, 2007. Retrieved February 4, 2007.
- ^ "Review of Fargo". The New York Times. Archived from the original on September 12, 2023. Retrieved February 11, 2007.
External links
- Minnesota State Climatology Office
- National Weather Service – Central Region Headquarters
- National Climatic Data Center
- Natural Disasters
- Minnesota's Fiercest Floods Documentary produced by Twin Cities PBS
- Minnesota's Deadliest Blizzards Documentary produced by Twin Cities PBS
- Minnesota's Deadliest Tornadoes Documentary produced by Twin Cities PBS