Subboreal
| Preceded by the Pleistocene |
| Holocene Epoch |
|---|
 |
|
|
|
Blytt–Sernander stages/ages
*Relative to year 2000 (b2k). †Relative to year 1950 (BP/Before "Present"). |
The Subboreal is a climatic period, immediately before the present one, of the Holocene. It lasted from 3710 to 450 BCE.
Etymology
The composite scientific term Subboreal, meaning "below the Boreal," is derived from the
History
The Subboreal followed the Atlantic and was followed by the Subatlantic. The Subboreal is equivalent to W. H. Zagwijn's pollen zones IVa and IVb[3] and T. Litt's pollen zone VIII.[4] In the pollen scheme of Fritz Theodor Overbeck, it occupies pollen zone X.
In
Dating
The Subboreal is usually defined as 5660 to 3710 years BP. The lower limit is flexible, as some authors prefer to use 4400 BCE, or 6350 BP[5] in northwestern Poland, even 4830 BC, or 6780 BP,[6] And others use 5000 calendar years, or 3050 BCE. The upper limit of the Subboreal and, therefore the beginning of the Subatlantic, is also flexible and can be attributed to 1170 to 830 BCE,[7] but it is usually fixed at 450 BCE. In varve years, the Subboreal corresponds to 5660 to 2750 years BP.[8]
The boundary between the older and the younger Subboreal is considered to be 1350 BCE.
Climatic evolution

The climate was generally drier and slightly cooler (by about 0.1 °C) than in the preceding Atlantic but still warmer than today. The temperatures were 0.7 °C higher than during the following Subatlantic. Consequently, in Scandinavia the lower limit of glaciers was 100 to 200 m higher than during the Subatlantic.[9] On the whole, the oscillating temperatures slightly receded in the course of the Subboreal by about 0.3 °C.[citation needed]
In the
In
In
The Levant shows a similar climatic evolution.[15] The dry conditions prevailing in Mesopotamia around 4200 years BP probably resulted in the downfall of the Akkadian Empire.[16]
Carbon dioxide
Levels of carbon dioxide had reached at the beginning of the Subboreal its Holocene minimal value of 260 ppm. During the Subboreal, it started rising and reached 293 ppm at the end of the period.[17] As a comparison, today's value is over 400 ppm.[18]
Vegetation history

In
Another important event was the immigration of
The relatively-dry climate during the subboreal furthered the spreading of heath plants (Ericaceae).
Sea level

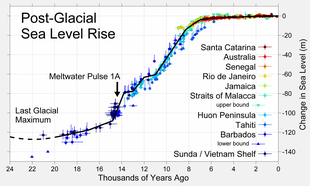
Like in the Atlantic period, the global sea level kept on rising during the Subboreal but at a much slower rate. The increase amounted to about 1 m, which corresponds to a rate of 0.3 mm per year. At the end of the Subboreal, the sea level was about 1 m below the current value.
Evolution in the Baltic
In the
Evolution in the North Sea region
In the
References
- ^ Sernander, R. (1889). Om växtlämningar i Skandinaviens marina bildningar. Bot. Not. 1889, p. 190-199, Lund.
- ^ BIytt, A. (1876a). Immigration of the Norwegian Flora. Alb. Cammermeyer. Christiania (Oslo), p. 89.
- ^ Waldo Heliodoor Zagwijn (1986). Nederland in het Holoceen. Geologie van Nederland, Deel 1, p. 46. Rijks Geologische Dienst Haarlem (editors). Staatsuitgeverij, 's-Gravenhage.
- .
- ^ Herking, C. M. (2004). Pollenanalytische Untersuchungen zur holozänen Vegetationsgeschichte entlang des östlichen unteren Odertals und südlichen unteren Wartatals in Nordwestpolen. Dissertation, Göttingen, Georg-August-Universität.
- .
- S2CID 128772330.
- ^ S2CID 129921808.
- S2CID 129377143.
- S2CID 128619029.
- .
- S2CID 140187593. Archived from the originalon 2008-10-10.
- .
- .
- S2CID 55095533.
- S2CID 31745857.
- ^ Parrenin, F., Loulergue, L. & Wolff, E. (2007). EPICA Dome C Ice Core Timescales. World Data Center for Paleoclimatology Data Contribution Series # 2007-083.NOAA/NCDC Paleoclimatology Program. Boulder CO, USA.
- .
- S2CID 161720225.
- ^ Behre, K.-E. & Kucan, D. (1994). Die Geschichte der Kulturlandschaft und des Ackerbaus in der Siedlungskammer Flögeln, Niedersachsen. Probleme der Küstenforschung im südlichen Nordseegebiet, 21, p. 1-227.
- ^ Kubitz, B. (2000). Die holozäne Vegetations- und Siedlungsgeschichte in der Westeifel am Beispiel eines hochauflösenden Pollendiagrammes aus dem Meerfelder Maar. Dissertationes Botanicae, 339, p. 106.
