Žabalj
Žabalj
Жабаљ (Serbian) | |
|---|---|
Town and municipality | |
 Orthodox church in Žabalj | |
|
UTC+2 (CEST) | |
| Postal code | 21230 |
| Area code | +381 21 |
| Car plates | NS |
| Website | www |


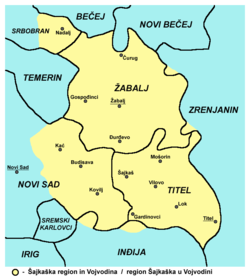
Žabalj (Serbian Cyrillic: Жабаљ, pronounced [ʒǎːbaʎ]; Hungarian: Zsablya) is a town and municipality located in the South Bačka District of the autonomous province of Vojvodina, Serbia. In 2023 the town Žabalj has a population of 9,107 and the municipality Žabalj has a population of 25,777. It is located in southeastern part of Bačka, known as Šajkaška. All settlements in the municipality have an ethnic Serb majority.
Name
Its name came from the Serbian word "žaba"/жаба ("frog" in English). In Serbian, the town is known as Žabalj (Жабаљ), in Hungarian as Zsablya or Józseffalva (between 1886 and 1919), in German as Josefdorf, and in Croatian as Žabalj.[citation needed]
History
Žabalj was first mentioned in 1514 as Zeble, a fortress captured by György Dózsa. During the Ottoman rule (16th-17th century), it was populated by ethnic Serbs.
In the 18th and 19th centuries, Žabalj was part of the
It belonged to
After the 1941 annexation of the town by Hungary, in a 1942 raid, 666 inhabitants of the town were murdered: 355 men, 141 women, 101 children, and 69 elderly people. Those who were liable, were convicted by Hungary in 1943.
During the
Inhabited places
Žabalj municipality encompasses the town of Žabalj, and the following villages:
Demographics
This section needs to be updated. (January 2012) |
Historical population of the town
- 1961: 7,457
- 1971: 7,851
- 1981: 8,503
- 1991: 8,766
Ethnic groups
The population of the Žabalj municipality:
Economy
The following table gives a preview of total number of employed people per their core activity (as of 2017):[3]
| Activity | Total |
|---|---|
| Agriculture, forestry and fishing | 253 |
| Mining | 21 |
| Processing industry | 664 |
| Distribution of power, gas and water | 32 |
| Distribution of water and water waste management | 84 |
| Construction | 138 |
| Wholesale and retail, repair | 937 |
| Traffic, storage and communication | 216 |
| Hotels and restaurants | 98 |
| Media and telecommunications | 17 |
| Finance and insurance | 30 |
| Property stock and charter | 3 |
| Professional, scientific, innovative and technical activities | 112 |
| Administrative and other services | 59 |
| Administration and social assurance | 217 |
| Education | 406 |
| Healthcare and social work | 284 |
| Art, leisure and recreation | 47 |
| Other services | 91 |
| Total | 3,708 |
Gallery
-
Monument of the 1942 raid victimsnear Žabalj
-
The Catholic Church
See also
- Šajkaška
- South Bačka District
- List of places in Serbia
- List of cities, towns and villages in Vojvodina
References
- Slobodan Ćurčić, Broj stanovnika Vojvodine, Novi Sad, 1996.
- Zvonimir Golubović, Racija u južnoj Bačkoj 1942. godine, Novi Sad, 1991.
- Dr Dušan J. Popović, Srbi u Vojvodini, knjiga 1, Novi Sad, 1990.
References
- ^ "Municipalities of Serbia, 2006". Statistical Office of Serbia. Retrieved 2010-11-28.
- ISBN 978-86-6161-109-4. Retrieved 2014-06-27.
- ^ "ОПШТИНЕ И РЕГИОНИ У РЕПУБЛИЦИ СРБИЈИ, 2018" (PDF). stat.gov.rs (in Serbian). Statistical Office of the Republic of Serbia. Retrieved 17 March 2019.


