
Hydrogen isotope biogeochemistry
This article may be too long to read and navigate comfortably. (September 2022) |
Hydrogen isotope biogeochemistry is the scientific study of biological, geological, and chemical processes in the environment using the distribution and relative abundance of
History of hydrogen isotopes
Earliest work
The study of

Also in 1934, scientists
Impact on physical chemistry
The discovery of hydrogen isotopes also impacted the field of

While tritium radioactivity discourages use in


In
Impact on biogeochemistry
In biogeochemistry, scientists focused primarily on the stable isotope of deuterium as a tracer for environmental processes, especially the
In this early stage of hydrogen stable isotope study, most isotope compositions or fractionations were reported as bulk measurements of all
Measurements of individual compounds was made possible in the late 1990s and early 2000s with advancements in
Important concepts
Stable vs radioactive isotopes
All isotopes of a chemical element contain the same number of protons with varying numbers of neutrons. The element hydrogen has three naturally occurring isotopes, 1H, 2H and 3H, which are sometimes referred to as protium (H), deuterium (D) and tritium (T), respectively. Both 1H and 2H are stable indefinitely, while 3H is unstable and undergoes beta decay to form 3He. While there are some important applications of 3H in geochemistry (such as its use as an ocean circulation tracer) these will not be discussed further here.
Isotope notation
The study of stable isotope biogeochemistry involves the description of the relative abundances of various isotopes in a certain chemical pool, as well as the way in which physicochemical processes change the fraction of those isotopes in one pool vs. another. Various type of notation have been developed to describe the abundance and change in the abundance of isotopes in these processes, and these are summarized below. In most cases only the relative amounts of an isotope are of interest, the absolute concentration of any one isotope is of little importance.
Isotope ratio and fractional abundance
The most fundamental description of hydrogen isotopes in a system is the relative abundance of deuterium and protium. This value can be reported as the isotope ratio 2R or the fractional abundance 2F defined as:

and

where 2H and 1H are the amounts of deuterium and protium, respectively. Fractional abundance is equivalent to mole fraction, and yields atom percent when multiplied by 100. In some instances atom percent excess is used, which reports the atom percent of a sample minus the atom percent of a standard.
Delta (δ) notation
Isotope ratios for a given substance are often reported compared to a standard with known isotopic composition, and measurements of relative masses are always made in conjuncture with measuring a standard. In the case of hydrogen the Vienna Standard Mean Ocean Water standard is used which has an isotope ratio of 155.76 ±0.1 ppm. The delta value as compared to this standard is defined as:

These delta values are often quite small, and are usually reported as per mil values (‰) which come from multiplying the above equation by a factor of 1000.
Measures of fractionation
The study of hydrogen isotope biogeochemistry relies on the fact that various physicochemical processes will preferentially enrich or deplete deuterium relative to protium (see kinetic isotope effect, etc.). There are various measures that have been developed to describe the fractionation in an isotope between two pools, often the product and reactant of a physiochemical process. α notation describes the difference between two hydrogen pools A and B with the following equation:

where δ2HA is the delta value of pool A relative to VSMOW. As many delta values do not vary greatly from one another the α value is often very close to unity. A related measure called epsilon (ε) is often used which is given simply by:

These values are often very close to zero, and are reported as per mill values by multiplying α-1 by 1000. One final measure is Δ, pronounced "cap delta", which is simply:

Conservation of mass in mixing calculations
As discussed above, deuterium and protium are stable isotopes which never undergo radioactive decay. Therefore, the D/H ratio of a pool containing hydrogen will remain constant as long as no hydrogen is added or removed from the system, a property known as conservation of mass. When two pools of hydrogen A and B mix with molar amounts of hydrogen mA and mB, each with their own starting fractional abundance of deuterium (FA and FB), then the fractional abundance of the resulting mixture is given by the following exact equation:

The terms with Σ represent the values for the combined pools. It is often common to find the following approximation used for calculations regarding the mixing of two pools with a known isotopic composition:

This approximation is convenient and applicable with little error in most applications having to deal with pools of hydrogen from natural processes. The maximum difference between the calculated delta value with the approximate and exact equations is given by the following equation:
![{\displaystyle \delta _{error}=(R_{std})[(\delta _{A}-\delta _{B})/2]^{2}}](https://wikimedia.org/api/rest_v1/media/math/render/svg/b9e75bbdba61b6e69549fea3e203581ccaca9704)
This error is quite small for nearly all mixing of naturally occurring isotope values, even for hydrogen which can have quite large natural variations in delta values.[35] The estimation is usually avoided when unnaturally large isotope delta values are encountered, which is particularly common in isotopic labeling experiments.
Naturally occurring isotope variation
Natural processes result in broad variations in the D/H ratio found in different pools of hydrogen. Kinetic isotope effects and physical changes such as precipitation and evaporation lead to these observed variations. Ocean water varies slightly, between 0 and −10 per mil, while atmospheric water can be found to vary between approximately −200 to +100 per mil. Biomolecules synthesized by organisms will retain some of the D/H signature of the water which they were grown on, plus a large fractionation factor which can be as great as several hundred per mil. Large D/H differences amounting to thousands of per mil can be found between Earth and other planetary bodies such as Mars, likely due to variations in isotope fractionation during planet formation and the physical loss of hydrogen to space.
List of well known fractionation effects
A number of common processes fractionate hydrogen isotopes to produce the isotope variations found in nature. Common physical processes include precipitation and evaporation. Chemical reactions also have the potential to heavily influence the partitioning of heavy and light isotopes between pools. The rate of a chemical reaction depends in part on the energies of the chemical bonds being formed and broken in the reaction. Since different isotopes have different masses, the bond energies are different between different
Isotope ratio as tracer for fingerprint
In many areas of study the origin of a chemical or group of chemicals is of central importance. Questions such as the source of environmental pollutants, the origin of hormones in an athlete's body, or the authenticity of foods and flavorings are all examples where chemical compounds need to be identified and sourced. Hydrogen isotopes have found uses in these and many other diverse areas of study. Since many processes can affect the D/H ratio of a given chemical compound this ratio can be a
Physical chemistry
Hydrogen isotope formation

Quantum properties
Kinetic and equilibrium isotope effects
Isotopes differ according to their number of

- Calculating the reduced mass of a hydrogen-hydrogen bond versus a deuterium-deuterium bond gives:


- The quantum harmonic oscillator has energy levels of the following form, where k is the spring constant and h is Planck's constant.[41]

The effects of this energy distribution manifest in the
Kinetic isotope effects are common in biological systems and are especially important for hydrogen isotope biogeochemistry. Kinetic effects usually result in larger fractionations than equilibrium reactions. In any isotope system, kinetic effects are stronger for larger mass differences. Light isotopes in most systems also tend to move faster but form weaker bonds. At high temperatures, entropy explains a large signal in isotope composition. However, when temperature decreases isotope effects are more expressed and randomness plays less of a role. These general trends are exposed in further understanding of bond breaking, diffusion or effusion, and condensation or evaporation reactions.
Chemistry of hydrogen exchange
One of the major complications in studying hydrogen isotopes is the issue of exchangeability. At many time scales, ranging from hours to geological epochs, scientists have to consider if the hydrogen moieties in studied molecules are the original species or if they represent exchange with water or mineral hydrogen near by. Research in this area is still inconclusive in regards to rates of exchange, but it is generally understood that hydrogen exchange complicates the preservation of information in isotope studies.
Rapid exchange
Hydrogen atoms easily separate from
Carbon bound hydrogen exchange
For some time, researchers believed that large hydrocarbon molecules were impervious to hydrogen exchange, but recent work has identified many reactions that allow isotope reordering. The isotopic exchange becomes relevant at geological time scales and has impacted work of biologists studying lipid biomarkers as well as geologists studying ancient oil. Reactions responsible for exchange include[46][47]

- Radical reactionsthat cleave C-H bonds.
- Ionic exchange that of tertiary and aromatic hydrogen.
- alpha carbons.
- stereochemical inversion.
- Constitutional exchange like methyl shifts, double bond migrations and carbon backbone rearrangements.
Detailed kinetics of these reactions have not been determined. However, it is known that
Many of these reactions have a strong temperature dependence, with higher temperatures typically accelerating exchange. However, different mechanisms may prevail at each temperature window.
Vapor isotope effects
Vapor isotope effects occur for protium, deuterium, and tritium, because each isotope has different thermodynamic properties in the liquid and gaseous phases.[52] For water molecules, the condensed phase is more enriched while the vapor is more depleted. For example, rain condensing from a cloud will be heavier than the vapor starting point. Generally, the large variations in deuterium concentrations of water are from the fractionations between liquid, vapor, and solid reservoirs. In contrast to the fractionation pattern of water, non-polar molecules like oils and lipids, have gaseous counterparts enriched with deuterium relative to the liquid.[28] This is thought to be associated with the polarity from hydrogen bonding in water that does not interfere in long-chain hydrocarbons.
Observed variations in isotope abundance
This article may require cleanup to meet Wikipedia's quality standards. The specific problem is: δD is used over and over again without being defined; it might also be worth translating into a simpler measure of relative or absolute abundance for less technical readers. (May 2019) |

Due to physical and chemical fractionation processes, the variations in the isotopic compositions of elements are reported, and the standard
Hydrosphere
Oceans

Variations in δD value of different water sources and ice caps are observed due to
The isotope composition of seawater (not just the surface water) is mostly in the range of 0-(-10) ‰. The estimates of the δD values for different parts of the oceans across the world are shown on the map.[55]
Ice caps

The typical δD values for the ice sheets in the polar regions range from around −400‰ to −300‰ (‰SMOW).[57] The δD values for ice caps are affected by the distance from the open ocean, latitude, atmospheric circulation as well as the amount of insolation and temperature. The temperature change affects the deuterium content of ice caps, so the H/D isotopic composition of ice can give estimates for the historical climate cycles such as the timelines for interglacial and glacial periods. [See section 7.2. Paleo-reconstruction for more details]
The δD values of ice caps from 70 km south of Vostok Station and in East Antarctica are −453.7‰ and −448.4‰ respectively, and are shown on the map.[58]
Atmosphere

The analysis done based on satellite measurement data estimates the δD values for the atmosphere in various regions of the world. The general trend is that the δD values are more negative at higher-latitude regions, so the atmosphere above the Antarctica and the arctic regions is observed to be highly D-depleted to around −230‰ to −260‰ or even lower.
The estimates of the atmospheric δD values are shown on the map.[60]
A vast portion of the global atmospheric water vapor comes from the
2O is faster than 1HD16O due to a higher vapor pressure. On the other hand, the rain water (precipitation) is in general more enriched than the atmospheric water vapor.[62][63]
Precipitation

The δD values of the annual
The overall mean precipitation is determined by balance between the evaporation of water from the oceans and surface water sources and the condensation of the atmospheric water vapor in the form of rain. The net evaporation should equal the net precipitation, and the δD value for the mean isotopic composition of global precipitation is around −22‰ (global average).
Lakes and rivers

The δD values vs. VSMOW of lakes in different regions are shown on the map.[69] The general pattern observed indicates that the δD values of the surface waters including lakes and rivers are similar to that of local precipitation.[70]
Soil water
The isotopic composition of soil is controlled by the input of precipitation. Therefore, the δD values of soil across regions are similar to that of local precipitation. However, due to evaporation, soil tends to be more D-enriched than precipitation. The degree of enrichment varies greatly depending on the atmospheric humidity, local temperature as well as the depth of the soil beneath the surface. According to the study done by Meinzer et al. (1999), as the depth in the soil increases, the δD of soil water decreases.[70]
| Source | δD | Reference |
|---|---|---|
| Surface ocean | −70‰ to −50‰ | Clog et al. (2013) |
| Deep ocean | −10‰ to 0‰ | Englebrecht and Sachs (2005) |
| Ice caps | −450‰ to −300‰ | Lecuyer et al. (1998), Masson-Delmotte et al. (2008) |
| Atmosphere | −260‰ to −80‰ | Frankenberg et al. (2009) |
| Precipitation | −270‰ to +30‰ | waterisotopes.org |
| Lakes | −130‰ to +50‰ | Sachse et al. (2012) |
| Soil water | −270‰ to +30‰ | waterisotopes.org |
Biosphere
Marine algae
The factors affecting δD values of algal
In the study done by Zhang et al. (2009), the δD values of fatty acids in Thakassiosira pseudonana chemostat cultures were −197.3‰, −211.2‰ and −208.0‰ for C14, C16 and C18 fatty acids respectively. Moreover, the δD value of C16 fatty acid in an algal species named A. E. unicocca at 25 °C was determined using the empirical equation y = 0.890x – 91.730 where x is the δD of water at harvest. For another algal species named B. V. aureus, the equation was y = 0.869x −74.651.[71]
The degree of D/H fractionation in most algal lipids increases with increasing temperature and decreases with increasing salinity. The growth rates have different impacts on the D/H fractionation depending on the species types.[72]
Phytoplankton and bacteria
The δD values of lipids from
The H isotopic composition of
- Rl = Xwαl/wRw + (1 – Xw)αl/sRs,[74]
where Rl, Rw, and Rs are the D/H ratios of lipids, water, and substrates, respectively. Xw is the mole fraction of lipid H derived from external water, whereas αl/w and αl/s denote the net isotopic fractionations associated with uptake and utilization of water and substrate hydrogen, respectively.
For Phototrophs, Rl is calculated assuming that Xw equals to 1. The isotopic fractionation between lipids and methane (αl/m) is 0.94 for fatty acids and 0.79 for isoprenoid lipids. The isotopic fractionation between lipids and water (αl/w) is 0.95 for fatty acids and 0.85 for isoprenoid lipids. For plants and algae, the isotopic fractionation between lipids and methane (αl/m) is 0.94 for fatty acids and 0.79 for isoprenoid lipids.[74]
The δD values for lipids in bacterial species
Source:[71]
- Lipids in organisms growing on heterotrophicsubstrates:
- Growing on sugar: depletion of 200‰ ~ 300‰ relative to water
- Growing on direct precursor of succinate): enrichment of −50‰ ~ +200‰ relative to water
- αl/w: -150‰ ~ +200‰
- Lipids in organisms growing photoautotrophically:
- Depletion of 50‰ ~ 190‰ relative to water
- αl/w: -150‰ ~ -250‰
- Lipids in organisms growing chemoautotrophically:
- αl/w: -200‰ ~ -400‰
Plants

δD values for n-C29


| Plant group | Equation for estimating δD |
|---|---|
| Shrubs | |
| Trees | |
| Forbs | |
| C3 graminoids | |
| C4 graminoids |


For plant leaf wax, the relative humidity, the timing of leaf wax formation and the growth conditions including light levels affect the D/H fractionation of plant wax. From the Craig–Gordon model, it can be understood that leaf water in the growth chamber gasses is significantly D-enriched due to transpiration.[77]
Sugars
The relative global abundance of D in plants is in the following order: phenylpropanoids > carbohydrates > bulk material > hydrolysable lipids > steroids.[78] In plants, δD values of carbohydrates, which typically range around -70‰ to -140‰, are good indicators of the photosynthetic metabolism. Photosynthetically produced Hydrogens which are bound to carbon backbones are around 100–170‰ more D-depleted than the water found in plant tissues.
The heterotrophic processing of carbohydrates involves
The deuterium content of the sugars from the above plant species are not distinctive. In C3 plants, Hydrogens attached to Carbons in 4 and 5 positions of the glucose typically come from NADPH in the photosynthetic pathway, and are found to be more D-enriched. Whereas in C4 plants, Hydrogens attached to Carbons 1 and 6 positions are more D-enriched. D-enrichment patterns in CAM species tend to be closer to that in C3 species.[80]
Bulk organic matter
The H/D isotopic composition of the leaf water is variable during the biosynthesis, and the enrichment in the whole leaf can be described by the equation, △Dleaf = △De × ((1 - e−p)/P) [81][76]
The typical δD value of bulk plant is around −160‰ where δD values for cellulose and lignin are −110‰ and −70‰ respectively.[78]
Animals
The hydrogen isotopic composition in animal tissues are difficult to estimate due to complexities in the diet intake and the isotopic composition of surrounding water sources. When fish species were investigated, average hydrogen isotopic composition of proteins was in a large range of −128 ‰ ~ +203 ‰. In the bulk tissue of organisms, all lipids were found to be D-depleted, and the values of δD for lipids tend to be lower than that for proteins. The average δD for Chironomid and fish protein was estimated to be in the range of −128‰ to +203‰.[82]
Most hydrogens in
Although different δD values for the same class of compounds may arise in different organisms growing in water with the same δD value, those compounds generally have the same δD value within each organism itself. [See Section 7.5. Ecology for more details]
Lipids
The δD values of fatty acids found in living organisms typically range from −73‰ to −237‰. The values of δD for individual fatty acids vary widely between cultures (−362‰ to +331‰), but typically by less than around 30‰ between different fatty acids from the same species.[71]
The differences in δD for the compounds within the same lipid class is generally smaller than 50‰, whereas the difference falls in the range of 50–150‰ for the compounds in different lipid classes.[71]
δD values for typical lipid groups are determined using the following equation:
- εl/w = (D/H)l/(D/H)w−1 = [(δDl + 1)/(δDw + 1)]−1[76] where εl/w = net or apparent fractionation, δDl = lipid product and δDw = source water.
- The δD for common lipid classes found in living organisms are the following:
- n-alkyl: -170 ± 50‰ (113–262‰ more D-depleted than growth water)
- isoprenoid: -270 ± 75‰ (142–376‰ more D-depleted than growth water)
- phytol: -360 ± 50‰ (more depleted than the other two categories)
- n-
Polyisoprenoid lipids are more depleted than acetogenic (n-alkyl) lipids with more negative δD values.
| Type | Source | δD | Reference |
|---|---|---|---|
| Lipid | Marine Sediment | −470‰ to −30‰ | Zhang et al. (2008) |
| Marine Algae | −211‰ to −197‰ | Zhang et al. (2008) | |
| Methanotrophs | −170‰ to −50‰ | Sessions (2002) | |
| Heterotrophs | Enrichment of −50‰ to +200‰ relative to water | Zhang et al. (2008) | |
| Photoautotrophs | Enrichment of +50‰ to +190‰ relative to water | Zhang et al. (2008) | |
| Plants | −270‰ to −120‰ | Sachse et al. (2012) | |
| Sugar | Carbohydrates | −140‰ to −70‰ | Schmidt et al. (2003) |
| C3 plants | −132‰ to −117‰ | Schmidt et al. (2003) | |
| C4 plants | −91‰ to −75‰ | Schmidt et al. (2003) | |
| CAM | around −75‰ | Schmidt et al. (2003) | |
| Bulk | Plants | around −160‰ | Schmidt et al. (2003) |
| Animals (e.g. fish) | −128‰ to +203‰ | Soto et al. (2013) |
Geosphere
Oil
Source:[83]
- Oil samples from northeast Japan: from −130‰ to around −110‰ with higher maturity.[84]
- Oil samples from Portiguar Basin: -90‰ (lancustrine environment), -120‰ to -135‰ (marine-evaporitic environment),[85]
Alkenones

The isotopic composition of alkenones often reflect the isotopic enrichment or depletion of the surrounding environment, and the δD values of alkenones in different regions are shown on the map.[87][88]
Coals

Source:[90]
According to the studies done by Reddings et al., δD for coals from various sources range from around −90‰ to −170‰.[91]
The δD values of coals in different regions are shown on the map.[92][93]
Natural gas
Source:[94]
Methane
H2 gas
The δD value observed for atmospheric
Mineral H

The δD values of hydroxyl-bearing minerals of mantle were estimated to be −80‰ ~ -40‰ through the analysis of the isotopic composition for juvenile water. Hydrogen Minerals generally have large isotope effects, and the isotopic composition often follows the pattern observed for precipitation.
Clay minerals
The D/H fractionations in clays such as kaolinite, illite, smectite are in most cases consistent when no significant external forces are applied under constant temperature and pressure.
The following is an empirically determined equation for estimating the D/H fractionation factor: 1000 In αkaolinite-water = -2.2 × 10⁶ × T−2 – 7.7.[98]
The δD values vs. ‰SMOW for Hydrogen minerals found in
| Source | δD | Reference |
|---|---|---|
| Oil | −135‰ to −90‰ | Waseda (1993), dos Santos Neto and Hayes (1999) |
| Alkenones | −204‰ to −181‰ | Englebrecht and Sachs (2005) |
| Coals | −170‰ to −50‰ | Redding (1980), Rigby and Smith (1981), Smith (1983) |
| Natural Gas (Methane) | −400‰ to −100‰ | Whiticar (1999) |
| H2 Gas | −836‰ to +180‰ | Hoefs (2009) |
| Mineral H | −100‰ to −20‰ | Lecuyer et al. (1998) |
Extraterrestrial objects
Variations of D/H ratio in the Solar System[99]

- Earth
- The H isotope composition of Juvenile water (from degassing of the mantle), magmatic water (water equilibrated with a magma).
- Sun
- The D/H ratio of the Sun is around 21 ± 5 × 10⁻⁶.[101]
- Mars
- The current Hydrogen isotope composition is enriched by a factor of 5 relative to terrestrial ocean water due to continual losses of H in Martian atmosphere. Therefore, the δD value is estimated to be around +4000‰.
The D/H ratios for Jupiter and Saturn is nearly in the order of 10−5, and the D/H ratios of Uranus and Neptune is closer to the order of 10−4.[102]
Hydrogen is the most abundant element in the universe. Variations in isotopic composition of extraterrestrial materials stem from planetary
From the Helium isotope abundance data, the cosmic D/H value is estimated to be around 20 ppm which is much lower than the terrestrial D/H ratio of 150 ppm. The enrichment of D/H from the proto-solar reservoir occurs for most of the planets except for Jupiter and Saturn, the massive gaseous planets. The D/H ratios of the atmospheres of Venus and Mars are ~2 × 10⁻² and ~8 × 10⁻⁴ respectively. The D/H ratios of Uranus and Neptune is larger than that of protosolar reservoir by a factor of around 3 due to their deuterium-rich icy cores. The D/H ratios for comets are much larger than the values for the planets in the Solar System with δD value of around 1000‰.[103]
The Hydrogen isotope compositions in the galaxy and the Solar System are shown in the table.
Measurement techniques
Determination of D/H ratio can be performed with a combination of different preparation techniques and instruments for different purposes. There are several basic categories of hydrogen isotope measurements: (i) organic hydrogen or water are converted to H2 first, followed by high precision
Offline combustion and reduction
The conversion to simple molecules (i.e. H2 for hydrogen) is required prior to IRMS measurement for stable isotopes. This is due to several reasons with regard to hydrogen:
- organic molecules and some inorganic ones (e.g. CO2 + H2O) can have proton-exchange reactions with ion source of mass spectrometer and produce the products such as and that cannot be distinguished;
- isotope effects due to ionization and transmission in the mass spectrometer can vary with different molecular forms.[104] It would require standards in every different molecular form that is being measured, which is not convenient.


The classical offline preparation for the conversion is combustion over CuO at > 800 °C in sealed quartz tubes, followed by the isolation of resulting water and the reduction to H2 over hot metal at 400 ~1000 °C on a vacuum line.[105] The produced gas is then directly injected into the dual-inlet mass spectrometer for measurement.[104] The metals used for the reduction to H2 includes U, Zn, Cr, Mg and Mn, etc. U and Zn had been widely used since the 1950s[25][106][107][108][109][110] until Cr[111] was successfully employed in the late 1990s.
The offline combustion/reduction has the highest accuracy and precision for hydrogen isotope measurement without limits for sample types. The analytical uncertainty is typically 1~2‰ in δD. Thus it is still being used today when highest levels of precision are required. However, the offline preparation procedure is very time-consuming and complicated. It also requires large sample size (several 102 mg). Thus the online preparation based on combustion/reduction coupled with the subsequent continuous flow-IRMS (CF-IRMS) system has been more commonly used nowadays. Chromium reduction or high temperature conversion are the dominant online preparation methods for the detection of hydrogen isotope by IRMS.

High temperature conversion/elemental analyzer (TC/EA)
TC/EA (or HTC, high temperature conversion; HTP, high temperature pyrolysis; HTCR, high temperature carbon reduction) is an 'online' or 'continuous flow' preparation method typically followed by IRMS detection. This is a "bulk" technique that measures all of the hydrogen in a given sample and provides the average isotope signal. The weighed sample is placed in a tin or silver capsule and dropped into a pyrolysis tube of TC/EA. The tube is made of glassy carbon with glassy carbon filling in which way oxygen isotope can be measured simultaneously without the oxygen exchange with ceramic (Al2O3) surface.[113] The molecules are then reduced into CO and H2 at high temperature (> 1400 °C) in the reactor. The gaseous products are separated through gas chromatography (GC) using helium as the carrier gas, followed by a split-flow interface, and finally detected by IRMS. TC/EA method can be problematic for organic compounds with halogen or nitrogen due to the competition between the pyrolysis byproducts (e.g. HCl and HCN) and H2 formation.[114][115] In addition, it is susceptible to contamination with water, so samples must be scrupulously dried.
An adaption of this method is to determine the non-exchangeable (C-H) and exchangeable hydrogen (bounds to other elements, e.g. O, S and N) in organic matter. The samples are equilibrated with water in sealed autosampler carousels at 115 °C and then transferred into pyrolysis EA followed by IRMS measurement.[116]
TC/EA method is quick with a relatively high precision (~ 1‰). It was limited to solid samples, however, liquid sample recently can also be measured in TC/EA-IRMS system by adapting an autosampler for liquids. The drawback of TC/EA is the relatively big sample size (~ mg), which is smaller than offline combustion/reduction but larger than GC/pyrolysis. It cannot separate different compounds as GC/pyrolysis does and thus only the average for the whole sample can be provided, which is also a drawback for some research.

Gas chromatography/pyrolysis (GC/pyrolysis)
GC-interface (combustion or pyrolysis) is also an online preparation method followed by IRMS detection. This is a 'compound-specific' method, allowing separation of analytes prior to measurement and thus providing information about the isotopic composition of each individual compound. Following GC separation, samples are converted to smaller gaseous molecules for isotope measurements. GC/pyrolysis uses the pyrolysis interface between GC and IRMS for the conversion of H and O in the molecules into H2 and CO. GC-IRMS was first introduced by Matthews and Hayes in the late 1970s,[117] and was later used for δ13C, δ15N, δ18O and δ34S. Helium is used as the carrier gas in the GC systems. However, the separation of DH (m/z=3) signal from the tail of 4He+ beam was problematic due to the intense signal of 4He+.[118] During the early 1990s, intense efforts were made in solving the difficulties to measure δD by GC/pyrolysis-IRMS. In 1999, Hilkert et al. developed a robust method by integrating the high temperature conversion (TC) into GC-IRMS and adding a pre-cup electrostatic sector and a retardation lens in front of the m/z=3 cup collector. Several different groups were working on this at the same time.[118][119][120][121] This GC/pyrolysis-IRMS based on TC has been widely used for δD measurement nowadays. The commercial products of GC-IRMS include both combustion and pyrolysis interfaces so that δ13C and δD can be measured simultaneously.
The significant advantage of GC/pyrolysis method for hydrogen isotope measurement is that it can separate different compounds in the samples. It requires the smallest sample size (a typical size of ~ 200 ng[119]) relative to other methods and also has a high precision of 1~5 ‰. But this method is relatively slow and limited to the samples which can be applied in GC system.

Laser spectroscopy
Laser Spectroscopy is a quick and simple procedure, relatively lower cost and the equipment is portable. So it can be used in the field for measuring water samples. D/H and 18O/16O can be determined simultaneously from a single injection. It requires a small sample size of < 1 μL for water. The typical precision is ~ 1‰. However, this is the compound-specific instrument, i.e. only one specific compound can be measured. And coexisting organic compounds (i.e. ethanol) could interfere with the optical light absorption features of water, resulting in cross-contamination.
SNIF-NMR
2H-Site-specific Natural Isotope Fractionation-Nuclear Magnetic Resonance(
The mainstream
In summary, the underlying physics of the SNIF-NMR makes it capable of measuring
Intact molecular isotope ratio mass spectrometry
Conventionally, mass spectrometry, such as Gas Chromatography-Mass Spectrometry(
Recent advances in analytical instruments enable direct measurement of natural abundance D/H ratios in organic molecules. The new instruments have the same framework as any conventional gas source IRMS, but incorporate new features such as larger magnetic sector, double focusing sectors, quadrupole mass filter and multi-collectors. Two commercial examples are the Nu Panorama[138] and the Thermo Scientific 253 Ultra.[139] These instruments generally have good sensitivity and precision. Using only tens of nanomoles of methane, the Ultra can achieve a stable high precision of around 0.1‰ error in δD.[140] One of the first examples of this type of measurement has been the clumped isotopes of methane.(See section of "natural gas" in Fossil fuels) Another strength of this kind of instruments is the capability of doing site-specific isotopic ratio measurements. This technique is based on measuring D/H ratios of fragments from the ion source (e.g. CH3CH+
2 of propane molecule) that samples hydrogen atoms from different parts of the molecule.[141]
In summary, direct molecular mass-spectrometry has been commonly used to measure laboratory spiked isotope tracers. Recently advanced high resolution gas source isotope ratio mass spectrometers can measure hydrogen isotopes of organic molecules directly. These mass spectrometers can provide high precision and high sensitivity. The drawback of this type of instruments includes high cost, and standardization difficulty. Also, studying site-specific isotopes with mass spectrometry is less straightforward and needs more constraints than the SNIF-NMR method, and can only distinguish
Hydrologic cycle
Isotope fractionation in the hydrological cycle

Water is the primary source of hydrogen to all living organisms, so the isotopic composition of environmental water is a first-order control on that of the biosphere. The hydrological cycle moves water around different reservoirs on the surface of the earth, during which hydrogen isotopes in water are significantly fractionated.[142] As the primary moisture source to the atmosphere, the ocean has a relatively uniform hydrogen isotope composition across the globe around 0‰ (VSMOW).[143] Variations of δD larger than 10‰ in the ocean are generally confined to surface waters due to evaporation, sea ice formation, and addition of meteoric waters by precipitation, rivers or icebergs.[142] In the hydrological cycle, the two major processes that fractionate hydrogen isotopes from ocean water are evaporation and condensation. It should be pointed out that oxygen isotopic composition (18O/16O) of water is also an important tracer in the hydrological cycle, and cannot be separated from hydrogen isotopes when we talk about isotope fractionation processes associated with water.
During evaporation of water from the ocean to the atmosphere, both equilibrium and kinetic isotope effects occur to determine the hydrogen and oxygen isotopic composition of the resulting water vapor. At the water-air interface, a stagnant boundary layer is saturated with water vapor (100%
(‰)

(‰)

The magnitude of the liquid-vapor equilibrium fractionation for hydrogen isotopes is approximately 8 times that of oxygen isotopes at earth surface temperatures, which reflects the relative mass differences of the two isotope systems (2H is 100% heavier than 1H, 18O is 12.5% heavier than 16O). Above the boundary layer, there is a transition zone with relative humidity less than 100%, and there is a kinetic isotope fractionation associated with water vapor diffusion from the boundary layer to the transition zone, which is empirically related to the relative humidity (h):[145]
‰

‰

The kinetic isotope effect associated with diffusion reflects the mass difference of the heavy-isotope substituted water molecules (HD16O and H18
2O) relative to the normal isotopologue (H16
2O).
After water is evaporated to the atmosphere, it is transported and returned to the surface through condensation and precipitation. Condensation of water vapor occurs in ascending air masses that develop a lower temperature and saturation vapor pressure. Since the cooling and condensation happens at relatively slow rates, it is a process with equilibrium isotope effects. However, as water vapor is progressively condensed and lost from the air during moisture transport, the isotopic composition of the remaining vapor, as well as the resulting precipitation, can be largely depleted due to the process of Rayleigh distillation. The equation for Rayleigh distillation is:[146]


In the equation, R0 represents the isotope ratio in the initial water vapor, Rr represents the isotope ratio in the remaining water vapor after some condensation, f is the fraction of water vapor remaining in the air, and α is the liquid-vapor equilibrium fractionation factor (α=1+ε). The isotopic composition of the resulting precipitation (Rp) can be derived from the composition of the remaining vapor:

As f decreases progressively during condensation, the remaining vapor becomes more and more depleted of the heavy isotopes, and the magnitude of depletion becomes larger as f approaches zero. The Rayleigh distillation process can explain some first-order spatial patterns observed in the isotopic composition of precipitation across the globe, including isotopic depletion from the tropics to the poles, isotopic depletion from coastal to inland regions, and isotopic depletion with elevation over a mountain range,[1] all of which are associated with progressive moisture loss during transport. The Rayleigh distillation model can also be used to explain the strong correlation between δD and δ18O observed in global precipitation, expressed as the global meteoric water line (GMWL): δD = 8δ18O+10[147] (later updated to δD = 8.17±0.07 δ18O+11.27±0.65[41]) The slope of the GMWL reflects the relative magnitude of hydrogen and oxygen isotope fractionation during condensation. The intercept of GMWL is non-zero (called deuterium-excess, or d-excess), which means ocean water does fall on GMWL. This is associated with the kinetic isotope effect during evaporation when water vapor diffuses from the saturated boundary layer to the unsaturated transition zone, and cannot be explained by the Rayleigh model. Nevertheless, the robust pattern in GMWL strongly suggests a single dominant moisture source to the global atmosphere, which is the tropical western Pacific. It should also be pointed out that a local meteoric water line can have a different slope and intercept from the GMWL, due to differences in humidity and evaporation intensity at different places.[145] Hydrogen and oxygen isotopes in water thus serve as an excellent tracer of the hydrological cycle both globally and locally.
Water isotopes and climate
Based on the processes that fractionate isotopes in the hydrological cycle, isotopic composition of meteoric water can be used to infer related environmental variables such as air temperature, precipitation amount, past elevations, lake levels, as well as to trace moisture sources. These studies form the field of isotope hydrology. Examples of isotope hydrology applications include the following:
Temperature reconstruction
Isotopic composition of precipitation can be used to infer changes in air temperature based on the Rayleigh process. Lower temperature corresponds to lower saturation vapor pressure, which leads to more condensation that drives the residual vapor toward isotope depletion. The resulting precipitation thus has a more negative δD and δ18O value at lower temperature. This precipitation isotope thermometer is more sensitive at lower temperatures, and widely applied at high latitudes. For example, δD and δ18O were found to have a temperature sensitivity of 8‰/°C and 0.9‰/°C in Antarctic snow, and a sensitivity of 5.6‰/°C and 0.69‰/°C across Arctic sites.[148] δD and δ18O of ice cores in Greenland, Antarctica and alpine glaciers are important archives of temperature change in the geological past.
Precipitation amount effect
In contrast to temperature control at high latitudes, the isotopic composition of precipitation in the tropics is mainly influenced by rainfall amount (negative correlation). This "amount effect" is also observed for summer precipitation in the subtropics.[41][148] Willi Dansgaard, who first proposed the term "amount effect", suggested several possible reasons for the correlation: (1) As cooling and condensation progress, the rainfall isotopic composition reflects an integrated isotopic depletion by the Rayleigh process; (2) A small amount of rainfall is more likely to be influenced by evaporation and exchange with surrounding moisture, which tend to make it more isotopically enriched. At low latitudes, the amount effect for δ18O is around −1.6‰ per 100 mm precipitation increase at island stations, and −2.0‰ per 100 mm at continental stations.[148] It was also noted that the amount effect was most pronounced when comparing isotopic composition of monthly precipitation at different places in the tropics.[148] The amount effect is also expected for hydrogen isotopes, but there are not as many calibration studies. Across southeast Asia, the δD sensitivity to monthly precipitation amount varies between −15 and −25‰/100mm depending on location.[149] In temperate regions, the isotopic composition of precipitation is dominated by rainfall amount in summer, but more controlled by temperature in the winter.[148] The amount effect may also be complicated by changes in regional moisture sources.[150] Reconstructions of rainfall amount in the tropics in the geological past are mostly based on δ18O of speleothems[151][152] or δD of biogenic lipids,[153][154] both of which are thought of as proxies for the isotopic composition of precipitation.
Applications
Isotope hydrology
Hydrogen and oxygen isotopes also work as tracers for water budget in terrestrial reservoirs, including lakes, rivers, groundwater and soil water. For a lake, both the amount of water in the lake and the isotopic composition of the water are determined by a balance between inputs (precipitation, stream and ground water inflow) and outputs (evaporation, stream and ground water outflow).[142] The isotopic composition of lake water can often be used to track evaporation, which causes isotope enrichment in the lake water, as well as a δD-δ18O slope that is shallower than the meteoric water line.[155] The isotopic composition of river water is highly variable and have complicated sources over different timescales, but can generally be treated as a two-endmember mixing problem, a base-flow endmember (mainly ground water recharge) and an overland-flow endmember (mainly storm events). The isotope data suggest that the long-term integrated base-flow endmember is more important in most rivers, even during peak flows in summer.[142] Systematic river isotope data were collected across the world by the Global Network of Isotopes in Rivers (GNIR)[2].The isotopic composition of groundwater can also be used to trace its sources and flow paths. An example is a groundwater isotope mapping study in Sacramento, California, which showed lateral flow of river water with a distinct isotope composition into the groundwater that developed a significant water table depression due to pumping for human use.[156] The same study also showed an isotopic signal of agricultural water being recharged into the giant alluvial aquifer in California's Central Valley.[156] Finally, the isotopic composition of soil water is important for the study of plants. Below the water table, the soil has a relatively constant source of water with a certain isotopic composition. Above the water table, the isotopic composition of soil water is enriched by evaporation until a maximum at the surface. The vertical profile of isotopic composition of soil water is maintained by the diffusion of both liquid and vapor water.[157] A comparison of soil water and plant xylem water δD can be used to infer the depth at which plant roots get water from the soil.[158]
Paleo-reconstruction
Ice core records

The isotopic composition of ice cores from continental ice sheets and alpine glaciers have been developed as temperature proxies since the 1950s. Samuel Epstein was one of the first to demonstrate the applicability of this proxy by measuring oxygen isotopes in Antarctic snow, and also pointed out complications in the stable isotope-temperature correlation caused by the history of the air masses from which the snow formed.[160] Ice cores in Greenland and Antarctica can be thousands of meters thick and record snow isotopic composition of the past few glacial-interglacial cycles. Ice cores can be dated by layer counting on the top and ice flow modeling at depth, with additional age constraints from volcanic ash.[161] Cores from Greenland and Antarctica can be aligned in age at high-resolution by comparing globally well-mixed trace gas (e.g. CH4) concentrations in the air bubbles trapped in the cores.[162] Some of the first ice core records from Greenland and Antarctica with age estimates go back to the last 100,000 years, and showed a depletion in δD and δ18O in the last ice age.[163][164] The ice core record has since been extended to the last 800,000 years in Antarctica,[165] and at least 250,000 years in Greenland.[166] One of the best δD-based ice core temperature records is from the Vostok ice core in Antarctica, which goes back to 420,000 years.[159] The δD-temperature (of the inversion layer where snow forms) conversion in east Antarctica based on modern spatial gradient of δD (9‰/°C) is ΔTI=(ΔδDice-8Δδ18Osw)/9, which takes into account variations in seawater isotopic composition caused by global ice volume changes.[159] Many local effects can influence ice δD in addition to temperature. These effects include moisture origin and transport pathways, evaporation conditions and precipitation seasonality, which can be accounted for in more complicated models.[167] Nevertheless, the Vostok ice core record shows some very important results: (1) A consistent δD depletion of ~70‰ during the last four glacial periods compared to interglacial times, corresponding to a cooling of 8 °C in Antarctica; (2) A consistent drop of atmospheric CO2 concentration by 100 ppmv and CH4 drop by ~300 ppbv during glacial times relative to interglacials, suggesting a role of greenhouse gases in regulating global climate; (3) Antarctic air temperature and greenhouse gas concentration changes precede global ice volume and Greenland air temperature changes during glacial terminations, and greenhouse gases may be an amplifier of insolation forcing during glacial-interglacial cycles.[159] Greenland ice core isotope records, in addition to showing glacial-interglacial cycles, also shows millennial-scale climate oscillations that may reflect reorganization in ocean circulation caused by ice melt charges.[166][168][169][170] There have also been ice core records generated in alpine glacials on different continents. A record from the Andes Mountains in Peru shows a temperature decrease of 5-6 °C in the tropics during the last ice age.[171] A record from the Tibetan plateau shows a similar isotope shift and cooling during the last ice age.[172] Other existing alpine glacial isotope records include Mount Kilimanjaro in Tanzania, Mount Altai and West Belukha Plateau in Russia, Mount Logan in Canada, the Fremont Glacier in Wyoming, USA, and the Illimani Ice Core in Bolivia, most of which cover an interval of the Holocene epoch.[3]
Biomolecules
The isotopic compositions of biomolecules preserved in the sedimentary record can be used as a proxy for paleoenvironment reconstructions. Since water is the primary hydrogen source for photoautotrophs, the hydrogen isotope composition of their biomass can be related to the composition of their growth water and thereby used to gain insight into some properties of ancient environments.[173] Studying hydrogen isotopes can be very valuable, as hydrogen is more directly related to climate than other relevant stable isotope systems. However, hydrogen atoms bonded to oxygen, nitrogen, or sulfur atoms are exchangeable with environmental hydrogen, which makes this system less straightforward[174] [ref to earlier H exchange section]. To study the hydrogen isotope composition of biomolecules, it is preferable to use compounds where the hydrogen is largely bound to carbon, and therefore not exchangeable on experimental timescales. By this criterion, lipids are a much better subject for hydrogen isotope studies than sugars or amino acids.
The net fractionation between source water and lipids is denoted as εl/w, and can be represented as

where w refers to the water, and l refers to the lipids.
While the δD of source water is the biggest influence on the δD of lipids,[175] discrepancies between fractionation factor values obtained from the slope and from the intercept of the regression suggest that the relationship is more complex than a two-pool fractionation.[176] In other words, there are multiple fractionation steps that must be taken into account in understanding the isotopic composition of lipids.
Cellulose
The carbon-bonded hydrogen isotopic composition of cellulose, as inherited from leaf water, has the potential of preserving the original meteoric water signal. This was first demonstrated in the 1970s.[25][177] In a systematic survey across North America, tree cellulose δD was found to have a temperature sensitivity of 5.8‰/°C, similar to precipitation δD sensitivity of 5.6‰/°C.[178] This spatial correlation may be complicated by local effects of soil evaporation and leaf transpiration,[178] and the spatial gradient may not be representative of temporal changes in tree ring cellulose at a single place. The mechanism that generates the δD signal in cellulose from meteoric water is not completely understood, but at least includes leaf water transpiration, synthesis of carbohydrates, synthesis of cellulose from photosynthetic sugars, and exchange of sugars with xylem water.[179] Modeling studies show that observed tree ring cellulose δD can be produced when 36% of the hydrogen in sugars can exchange with xylem water, and effects such as humidity and rainfall seasonality may complicate the cellulose δD proxy.[179] Despite these complications, tree ring δD have been used for paleoclimate reconstructions of the past few millennia. For example, a tree ring cellulose δD records from pine trees in the White Mountains, California shows a 50‰ depletion from 6800 year ago to present. The cooling trend since the mid-Holocene thermal maximum is consistent with ice core and pollen records, but the corresponding magnitude of cooling is elusive due to complicated influences from local effects such as humidity and soil water composition.[180] The meaning of isotopes in cellulose and its applications is still an area of active study.
Plant leaf waxes

Terrestrial plants make leaf waxes to coat the surfaces of their leaves as an adaptation to minimize water loss. These waxes are largely straight-chain n-alkyl lipids. They are insoluble, non-volatile, chemically inert, and resistant to degradation, making them easily preserved in the sedimentary record, and therefore good targets as biomarkers.[181]
The main water source for terrestrial plants is soil water, which largely resembles the hydrogen isotope composition of rain water, but varies between environments and with enrichment by precipitation, depletion by evaporation, and exchange with atmospheric water vapor. There can be a significant offset between the δD value of source water and the δD value of leaf water at the site of lipid biosynthesis. No fractionation is associated with water uptake by roots, a process usually driven by capillary tension, with the one exception of xerophytes that burn ATP to pump water in extremely arid environments (with a roughly 10‰ depletion).[182] However, leaf water can be substantially enriched relative to soil water due to transpiration, an evaporative process which is influenced by temperature, humidity, and the composition of surrounding water vapor. The leaf water hydrogen isotope composition can be described with a modified Craig-Gordon model,[183] where ΔDe is the steady state enrichment of leaf water, εeq is the temperature-dependent equilibrium fractionation between liquid water and vapor, εk is the kinetic isotope effect from diffusion between leaf internal air space and the atmosphere, ΔDv is the leaf/air disequilibrium, ea is atmospheric vapor pressure, and ei is internal leaf vapor pressure.

The Péclet effect, which describes the opposing forces of advection and diffusion can be added to the model as

where E is the transpiration rate, L is the length scale of transport, C is the concentration of water, and D is the diffusion coefficient.

While the role of rain water δD as the fundamental control on the final δD of lipids is well documented,[184] the importance of fractionation effects from rain water to soil water and leaf water on εl/w is appreciated but remains poorly understood.[173][185]
Organic biomolecules are generally depleted relative to the δD of leaf water.[173] However, differences between organisms, biosynthetic pathways, and biological roles of different molecules can lead to huge variability in fractionation; the diversity of lipid biomarkers spans a 600‰ range of δD values.[186] Lipid biosynthesis is biochemically complex, involving multiple enzyme-dependent steps that can lead to isotope fractionations. There are three major pathways of lipid biosynthesis, known as the mevalonate pathway, the acetogenic pathway, and the 1-deoxyD-xylulose-5-phosphate/2-methylerythroyl-4-phosphate pathway.[187] The acetogenic pathway is responsible for the production of n-alkyl lipids like leaf waxes, and is associated with a smaller δD depletion relative to source water than the other two lipid biosynthesis pathways.[32][188] While leaf water is the main source of hydrogen in leaf biomolecules, relatively depleted hydrogen from acetate or NADPH is often added during biosynthesis, and contributes to the hydrogen composition of the final molecule. Secondary hydrogen exchange reactions, meaning hydrogenation and dehydrogenation reactions outside of the primary biosynthetic pathway, also contribute substantially to the variability of lipid hydrogen isotope composition[189]
It is important to note that biological differences in fractionation stem not only from biochemical differences between different molecules, but also from physiological differences between different organisms. For example, the δD values of multiple leaf wax molecules are enriched in shrubs (median ~ -90‰) relative to trees (median ~ -135‰), which themselves are enriched relative to both C3 (median ~ -160‰) and C4 grasses (median ~ -140‰).[173] Between individual species, substantial variation of δD values have been documented.[190][191][192][193] Other physiological factors that contribute to variable leaf wax δD values include the seasonal timing of leaf development,[194] response to external stress or environmental variability,[195] and the presence or absence of stomata[184]
It can be difficult to distinguish between physiological factors and environmental factors, when many physiological adaptations are directly related to environment.
Several environmental factors have been shown to contribute to leaf wax δD variability, in addition to environmental effects on the δD of source water. Humidity is known to impact lipid δD values at moderate humidity levels, but not at particularly high (>80%) or low (<40%) humidity levels, and a broad trend of enriched δD values, meaning smaller εl/w, is seen in arid regions.[173][175][190] Temperature and sunlight intensity, both correlated to geographic latitude, have strong effects on the rates of metabolism and transpiration, and by extension on εl/w.[196] Additionally, the average chain length of leaf wax molecules varies with geographic latitude, and εl/w has been shown to increase with increasing chain length[184]
When using biomarkers as a proxy for reconstructing ancient environments, it is important to be aware of the biases inherent in the sedimentary record. Leaf matter incorporated into sediment is largely deposited during the autumn, so seasonal variations in leaf waxes must be considered accordingly.[184] Furthermore, sediments average leaf waxes over lots of different plants in both space and time, making it difficult to calibrate the biological constraints on εl/w.[173] Finally, preservation of biomolecules in the geologic record does not faithfully represent whole ecosystems, and there is always the threat of hydrogen exchange, particularly if the sediments are subjected to high temperatures.
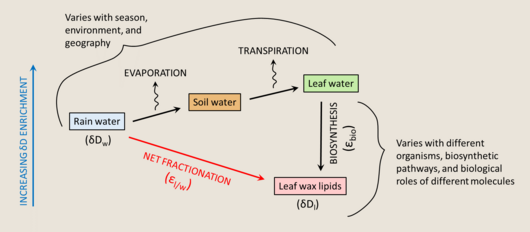
The hydrogen isotope composition of leaf waxes can be summarized as the δD of rain water, with three main fractionation steps- evaporation from soil water, transpiration from leaf water, and lipid biosynthesis, which can be combined and measured as the net fractionation, or εl/w.[173] With the application of ever-improving measurement techniques for single molecules, and correlation with other independent proxies in the geological record that can help constrain some variables, investigating the hydrogen isotope composition of leaf waxes can be extremely productive. Leaf wax δD data has been successfully applied to improving our understanding of climate driven changes in terrestrial hydrology, by demonstrating that ocean circulation and surface temperature have a significant effect on continental precipitation.[197][198] Leaf wax δD values have also been used as records of paleoaltimetry to reconstruct the elevation gradients in ancient mountain ranges based on the effect of altitude on rain water δD.[199][200]
Alkenones
Another group of molecules frequently used in paleoreconstructions are alkenones, long-chain largely unsaturated lipids produced exclusively by coccolithophores. Coccolithophores are marine haptophyte algae, and include the globally iconic species Emiliania huxleyi, one of the main CaCO3 producers in the ocean. The δD values of alkenones are highly correlated to the δD values of sea water, and therefore can be used to reconstruct paleoenvironmental properties that constrain the isotopic composition of sea water. The most notable reconstruction that alkenone δD values are applied to is the salinity of ancient oceans.
.png)
Both the δD values of sea water and the fractionations associated with hyptophyte biochemistry (εbio) are fairly well understood, so alkenones can be readily used to observe the secondary effect of salinity on δD.[201] There is a well established positive linear correlation between salinity and εl/w, on the order of a ~3‰ change in fractionation per salinity unit.[202] Hypothesized mechanisms for this effect include enrichment of D in intracellular water due to reduced exchange with extracellular water at higher salinity,[203] removal of H from intracellular water due to increased production of solutes to maintain osmotic pressure at higher salinity,[204] and lower haptophyte growth rates at higher salinity[173]
Alkenone δD values have been used successfully to reconstruct past salinity changes in the Mediterranean Sea.,[205] Black Sea,[206][207] Panama Basin,[208] and Mozambique Channel.[201] As an extension of salinity, this data was also used to draw further conclusions about ancient environments, such as ancient freshwater flooding events,[205][206] and the evolution of plankton in response to environmental changes[207]
Stable isotope paleoaltimetry
The possibility of using water isotope depletion with elevation to reconstruct paleoaltimetry was demonstrated as early as the late 1960s, when
Fossil fuels
The hydrogen isotope composition of oil, gas and coal is an important geochemical tool to study the formation, storage, migration and many other processes. The hydrogen isotopic signal of fossil fuels results from both inheritance of source material and water as well as fractionations during hydrocarbon generation and subsequent alteration by processes such as isotopic exchange or biodegradation. When interpreting hydrogen isotopic data of sedimentary organic matter one must take all the processes that might have an isotope effect into consideration.
Almost all of the organic hydrogen is exchangeable to some extent. Isotopic exchange of organic hydrogen will reorder the distribution of
The study of hydrogen isotopes of fossil fuels has been applied as proxies and tools in the following aspects:
- Reconstruction of paleolatitude.
- Source correlation. Marine and lacustrineenvironments are characterized by distinctly different δD values. Many studies have tried to relate measured δD with source types. For methane, D concentration and clumped isotopes is particularly diagnostic of sources.
- Possible maturity indicators. For example, isoprenoids synthesized by plants are strongly depleted in D(See "Observed variations in isotopic abundance" section), typically ~100‰ to n-alkyl lipids.[220] This gap tends to decrease as rock matures because of the higher D/H exchange rates of isoprenoids. The correlation of δD difference between pristane, phytane and n-alkanes and other maturity indicators has been established across a wide maturity range.[221][222] Another possible maturity indicator based on the "isotope slope" of δD vs. n-alkane chain length was proposed by Tang et al.[223]
- Quantitative apportionment. Since alkanes are main components of oil and gas, the isotopic data of n-alkanes have been used to study their migration and mixing. The advantage of hydrogen isotopes over carbon is higher resolution because of larger fractionation. Studying the clumped isotopes of methane provides a new dimension of mixing-constraints. The mixing line in the clumped isotope notation space is a curve rather than a straight line.
- Fingerprinting pollutant/oil spills.
Kerogens and coals
The first stage that sedimentary organic matter (SOM) experiences after deposition is diagenesis. During diagenesis, biological decomposition can alter the D/H ratio of organics. Several experimental studies have shown that some biodegraded materials become slightly enriched in D(less than 50‰). Most organics become kerogen by the end of diagenesis. Generally, δD of kerogen spans a wide range. Many factors contribute to the kerogen we observe in geological records, including:
- Source water hydrogen isotope patterns: For example, lake systems are more sensitive to hydrological cycles than marine environments.
- Differential fractionation for various organisms and metabolic pathways: differences in organic composition can also reflect in primary signal.
- Isotopic exchange, H loss and H addition: This can involve mixing water-derived D with the primary signal.
- Generation of bitumen, oil and gas: There's a fractionation between the product and kerogen.
Research on the Australian basins showed that δD of lacustrine algal sourced kerogen with terrestrial contributions varies from −105‰ to −200‰, and δD of kerogen from near-coastal depositional environment has a narrower range from −75‰ to −120‰.[224] The smaller span in D/H ratios of coastal kerogen is thought to reflect the relatively stable regional climate. Pedentchouk and his colleagues reported δD values of -70‰ to -120‰ in immature to low mature kerogen from early Cretaceous lacustrine sediments in West Africa.[221]
Coals are from type III kerogen mostly derived from terrestrial plants, which should have a primary D/H signal sensitive to local meteoric water. Reddings et al. analyzed coals from various origins and found them randomly scatter across the range of −90‰ to −170‰.[225] Rigby et al. found D contents decrease from -70‰ to -100‰ with increasing maturity in coal from Bass Basin and attributed this to latter exchange with low D water.[226] Smith et al. studied H isotopes of coal samples from Antarctica and Australia. They found a strong negative correlation between δD and inferred paleolatitude. For coal samples originating from near equatorial regions, δD is around −50‰, while for those originating from polar regions, δD is around −150‰.[227] This δD trend along latitude is consistent meteoric water trend and thus is an evidence that coals can preserve much of the original signals.
There are two types of approach to study the alteration of D/H ratios of kerogen during catagenesis: (1) Laboratory incubation of organic matter that enables mechanistic study with controlled experiments. (2) Natural sample measurement that provides information of combined effects over geological timescales. The complex composition and chemistry of kerogen complicates the results. Nevertheless, most research on hydrogen isotopes of kerogen show D enrichment with increasing maturity. Type II kerogen(marine derived) from New Albany Shale is reported to have δD rise from −120‰ to −70‰ as
In summary, D content of kerogen and coals are complicated and hard to resolve due to the complex chemistry. Nevertheless, studies have found the possible correlation between coal δD and paleo-latitude.
Natural gas
Commonly, hydrogen isotope composition of natural gas from the same well has a trend of δDmethane < δDethane < δDpropane < δDC4+. This is because most natural gas is thought to generated by step-wise thermal cracking that is mostly irreversible and thus governed by normal kinetic isotope effects that favor light isotopes. The same trend, known as "the normal order",[229] holds for carbon isotopes of natural gas. For example, Angola gas is reported to have a methane δD range of −190‰ to −140‰, an ethane δD of −146‰ to −107‰, a propane δD of −116‰ to −90‰, and a butane δD of −118‰ to −85‰.[230] However, some recent studies show that opposite patterns could also exist, meaning δDmethane > δDethane > δDpropane. This phenomenon is often referred to as 'isotopic reversal' or 'isotopic rollover'. The isotopic order could also be partially reversed, like δDmethane > δDethane < δDpropane or δDmethane < δDethane > δDpropane.[229] Burruss et al. found that in the deepest samples of northern Appalachian basin the hydrogen isotopic order for methane and ethane is reversed.[231] Liu et al., also found partial reversal in oil-related gas from the Tarim Basin.[229] The mechanism causing this reversal is still unknown. Possible explanations include mixing between gases of different maturities and sources, oxidation of methane, etc. Jon Telling et al., synthesized isotopically reversed (in both C and H) low-molecular alkanes using gas-phase radical recombination reactions in electrical discharge experiments, providing another possible mechanism.[232]
Methane is a major component of natural gas. Geosphere methane is intriguing for the large input of microbial methanogenesis. This process exhibits a strong isotope effect, resulting in greater D-depletion in methane relative to other hydrocarbons. δD ranges from −275‰ to −100‰ in thermogenic methane, and from −400‰ to −150‰ in microbial methane.[95] Also, methane formed by marine methanogens is generally enriched in D relative to methane from freshwater methanogens. δD of methane has been plotted together with other geochemical tools(like δ13C, gas wetness) to categorize and identify natural gas. A δD-δ13C diagram (sometimes referred to as CD diagram, Whiticar diagram, or Schoell diagram ) is widely used to place methane in one of the three distinct groups: thermogenic methane that is higher in both δ13C and δD; marine microbial methane that is more depleted in 13C and freshwater microbial methane that is more depleted in D. Hydrogenotrophic methanogenesis produces less D-depleted methane relative to acetoclastic methanogenesis. The location where the organism lives and substrate concentration also affect isotopic composition: rumen methanogenesis, which occurs in a more closed system and with higher partial pressures of hydrogen, exhibits a greater fractionation (−300 to −400‰) than wetland methanogenesis (−250 to −170‰).[233][234]

Recent advances in analytical chemistry have enabled high-precision measurements of multiply substituted
Oil
Oil is generally a product of thermal breakdown of type I and type II
Many studies of natural samples have shown slight increases in δD with thermal maturity. Amane Waseda reported δD of oil samples in northeast Japan to increase from around −130‰ to around −110‰ with higher maturity.
The bulk analysis of oil, which yields a complicated mixture of
N-alkanes are also known to preserve detailed information of source material. Li et al. studied oils from the marine-derived
Ecohydrology
The field of ecohydrology is concerned with the interaction between ecosystems and water cycling, from measuring the small scale drainage of water into soil to tracking the broad movements of water evaporating off from trees. Because deuterium acts as a conservative tracer, it works well for tracking water movement through plants and ecosystems. Although water movement in single-process phenomena such as evaporation is relatively simple to track, many systems (e.g. cloud forests) in the environment have multiple sources and tracking water movement becomes more complicated.[244] Isotope spiking can also be done to determine water transport through soil and into plants via injection of deuterated water directly into the ground.[245]
Stable isotope analysis of
Plant water can be used to characterize other plant physiological processes that affect the

Where WU is the water use in kilograms/day, M is the mass of deuterated water injected in grams, T is the final day of the experiment, Ci is the concentration of deuterium at time interval i in grams/kilogram, and Δti is the length of time interval i in days. Although the calculated water use via thermal dissipation probing of some tropical plants such as bamboos correlates strongly with measured water use found by tracking D2O movement, the exact values are not the same.

In this equation,
, φ is the fraction of fixed carbon that is respired, pCO2 is the partial pressure of CO2 in the atmosphere, εcarb is the fractionation of carboxylation, and εdiff is the fractionation of diffusion in air. The relation of δD in plant leaf waxes to δ13C has been empirically measured and results in a negative correlation of δD to water use efficiency. This can be explained in part by lower water use efficiency being associated with higher transpiration rates. Transpiration exhibits a normal isotope effect, causing enrichment of deuterium in plant leaf water and therefore enrichment of leaf waxes.

Ecology
Migration patterns
Deuterium abundance can be useful in tracking migration of various animals.[254] Animals with metabolically inert tissue (e.g. feathers or hair) will have synthesized that tissue using hydrogen from source water and food but ideally not incorporate subsequent water over the course of the migration. Because δD tends to vary geographically, the difference between animal tissue δD and post-migration water δD, after accounting for the biological fractionation of assimilation, can provide information regarding animal movement. In monarch butterflies, for example, wing chitin is metabolically inert after it has been built, so it can reflect the isotopic composition of the environmental water at the time and location of wing growth. This then creates a record of butterfly origin and can be used to determine migration distance.[255] This approach can also be used in bats and birds, using hair and feathers, respectively.[256][257] Since rainwater becomes depleted as elevation is increased, this method can also track altitudinal migration. However, this is technically difficult to do, and the resolution appears to be too poor to track small altitudinal changes.[257] Deuterium is most useful in tracking movement of species between areas with large continental water variation, because species movement can be complicated by the similarity of local water δD values between different geographic regions. For example, source water from Baja California may have the same δD as water from Maine.[258] Further, a proportion of the hydrogen isotope composition within the tissue can exchange with water and complicate the interpretation of measurements. In order to determine this percentage of isotopic exchange, which varies according to local humidity levels, standards of metabolically inert tissue from the species of interest can be constructed and equilibrated to local conditions. This allows measured δD from different geographic regions to be compared against each other.[259]
Trophic interactions
Assimilation of diet into tissue has a tissue-specific fractionation known as the trophic discrimination factor. Diet sources can be tracked through a food web via deuterium isotope profiles, although this is complicated by deuterium having two potential sources – water and food. Food more strongly impacts δD than does exchange with surrounding water, and that signal is seen across trophic levels.[260] However, different organisms derive organic hydrogen in varying ratios of water to food: for example, in quail, 20-30% of organic hydrogen was from water and the remainder from food. The precise percentage of hydrogen from water was dependent on tissue source and metabolic activity.[261] In chironomids, 31-47% of biomass hydrogen derived from water,[260] and in microbes as much as 100% of fatty acid hydrogen can be derived from water depending on substrate.[186] In caterpillars, diet δD from organic matter correlates linearly with tissue δD. The same relationship does not appear to hold consistently for diet δD from water, however – water derived from either the caterpillar or its prey plant is more deuterium enriched than their organic material. Going up trophic levels from prey (plant) to predator (caterpillar) results in an isotopic enrichment.[262] This same trend of enrichment is seen in many other animals - carnivores, omnivores, and herbivores - and appears to follow 15N relative abundances. Carnivores at the same trophic level tend to exhibit the same level of 2H enrichment.[263] Because, as mentioned earlier, the amount of organic hydrogen produced from water varies between species, a model of trophic level related to absolute fractionation is difficult to make if the participating species are not known. Consistency in measuring the same tissues is also important, as different tissues fractionate deuterium differently. In aquatic systems, tracking trophic interactions is valuable for not only understanding the ecology of the system, but also for determining the degree of terrestrial input.[33][264] The patterns of deuterium enrichment consistent within trophic levels is a useful tool for assessing the nature of these interactions in the environment.[33]
Microbial metabolism
Biological deuterium fractionation through metabolism is very organism and pathway dependent, resulting in a wide variability in fractionations.[186][265] Despite this, some trends still hold. Hydrogen isotopes tend to fractionate very strongly in autotrophs relative to heterotrophs during lipid biosynthesis - chemoautotrophs produce extremely depleted lipids, with the fractionation ranging from roughly −200 to −400‰.[266] This has been observed both in laboratory-grown cultures fed a known quantity of deuterated water and in the environment.[186][267] Proteins, however, do not follow as significant a trend, with both heterotrophs and autotrophs capable of generating large and variable fractionations.[266] In part, kinetic fractionation of the lighter isotope during formation of reducing equivalents NADH and NADPH result in lipids and proteins that are isotopically lighter.
Salinity appears to play a role in the degree of deuterium fractionation as well; more saline waters affect growth rate, the rate of hydrogen exchange, and evaporation rate. All of these factors influence lipid δD upon hydrogen being incorporated into biomass. In coccolithophores Emiliania huxleyi and Gephyrocapsa oceanica, alkenone δD has been found to correlate strongly to organism growth rate divided by salinity.[202] The relationship between deuterium fractionation and salinity could potentially be used in paleoenvironment reconstruction with preserved lipids in the rock record to determine, for example, ocean salinity at the time of organismal growth. However, the degree of fractionation is not necessarily consistent between organisms, complicating the determination of paleosalinity with this method.[202] There also appears to be a negative correlation between growth rate and fractionation in these coccolithophores. Further experiments on unicellular algae Eudorina unicocca and Volvox aureus show no effect of growth rate (controlled by nitrogen limitation) on fatty acid δD. However, sterols become more D-depleted as growth rate increases,[268] in agreement with alkenone isotopic composition in coccolithophores. Overall, although there are some strong trends with lipid δD, the specific fractionations are compound-specific. As a result, any attempt to create a salinometer through δD measurements will necessarily be specific to a single compound type.
Environmental chemistry
An important goal of environmental chemistry is tracing the source and degradation of pollutants. Various methods have been employed for fingerprinting pools of environmental pollutants such as the bulk chemical composition of a spill,[269] isotope ratios of the bulk chemical mixture,[270] or isotope ratios of individual constituent compounds. Stable isotopes of carbon and hydrogen can be used as complementary fingerprinting techniques for natural gas.[271] Recently, the D/H ratio of hydrocarbons from the Deepwater Horizon oil spill was used to verify that their origin was likely from the Macondo well.[272] Hydrogen isotope ratios have also been used as a measure of the relative amount of biodegradation that has occurred in oil reservoirs in China,[273] and studies on pure cultures of n-alkane degrading organisms have shown a chain-length dependence on the amount of hydrogen isotope fractionation during degradation.[274] Additional studies have also shown hydrogen isotope effects in the degradation of Methyl tert-butyl ether[275] and Toluene[276][277] that have been suggested to be useful in the evaluation of the level of degradation of these polluting compounds in the environment. In both cases the residual unreacted compounds became enriched in deuterium to a few tens of per mil, with variations exhibited between different organisms and degree of reaction completeness. These observations of heavy residual compounds have been applied to field observations of biodegradation reactions such as the removal of benzene and ethylbenzene,[278] which imparted a D/H fractionation of 27 and 50 per mil, respectively. Additionally analysis of o-xylene in a polluted site showed high residual D/H ratios after biodegradation, consistent with activation of C-H bonds being a rate limiting step in this process[279]
Source attribution and forensics
Stable isotope ratios have found uses in various instances where the authenticity or origin of a chemical compound is called into question. Such situations include assessing the authenticity of food, wine and natural flavors; drug screening in sports (see doping); pharmaceuticals; illicit drugs; and even helping identify human remains. In these cases it is often not sufficient to detect or quantify a certain compound, since the question is the origin of the compound. The strength of hydrogen isotope analysis in answering these questions is that in many cases the D/H ratio of a natural product is related to the natural water D/H values in the area where the product was formed (see: Hydrologic cycle). Since D/H ratios vary significantly between different geographic areas, this can serve as a powerful tool in locating the original source of many different substance.
Food and flavor authentication
Foods,
Doping
The isotope ratio of carbon in the steroids of athletes has been used to determine whether these steroids originated from the body of the athlete or an exogenous source. This test has been used in a number of high-profile anti-doping cases and has various benefits over simply characterizing the concentration of various compounds. Attempts are being made to create similar tests based on stable hydrogen isotopes[283] which could be used to complement the existing testing methods. One concern with this method was that the natural steroids produced by the human body may vary significantly based on the deuterium content of drinking water, leading to false detection of doping based on hydrogen isotope differences. This concern has been addressed in a recent study which concluded that the effect of D/H ratio of drinking water did not pose an insurmountable source of error for this anti-doping testing strategy.[284]
Pharmaceutical copies
The pharmaceutical industry has revenues in the hundreds of
Illicit drugs
The sources and production mechanisms of
Provenance of human remains
The geographical variation in D/H ratio in human drinking water is recorded in hair. Studies have shown a very strong relation between an individual's hair and drinking water D/H ratios.[294]
Since tap water D/H ratio has a strong dependence on geography, a person's hair D/H ratio can be used to determine regions in which they were most likely living during hair growth. This idea has been used in criminal investigations to try and constrain the movements of a person prior to their death, in much the same way D/H ratios have been used to track animal migrations. By analyzing sections of hair of varying ages it is possible to determine in what D/H regions a person was living at a specific time prior to their death.[295]
See also
- Abundance of chemical elements
- Hydrogen isotope
- Natural abundance
- Stable isotopes
References
- .
- .
- ^ "The Nobel Prize in Chemistry 1934". www.nobelprize.org. Retrieved 2016-05-13.
- ^ a b "Lawrence and His Laboratory: Episode: A Productive Error". www2.lbl.gov. Retrieved 2016-05-13.
- .
- PMID 27551621.
- PMID 1737021.
- PMID 17386654.
- .
- ^ "Ray-Freeman.org | The Dawn of NMR". www.ray-freeman.org. Archived from the original on 2016-03-09. Retrieved 2016-05-13.
- .
- ISBN 9781402038945.
- PMID 15631492.
- ^ "Tritium Production - Nuclear Weapons". fas.org. Archived from the original on 2016-05-03. Retrieved 2016-05-13.
- ^ a b "Operation Greenhouse". nuclearweaponarchive.org. Retrieved 2016-05-13.
- ^ "Congress to Address Helium-3 Shortage Hurting Scientific Research and Nuclear Security". Popular Science. 20 April 2010. Retrieved 2016-05-13.
- ^ Eveleth, Rose. "Nuclear Bombs Made It Possible to Carbon Date Human Tissue". Smithsonian. Retrieved 2016-05-13.
- ^ Laboratory, US Department of Commerce, NOAA, Earth System Research. "ESRL Global Monitoring Division - Education and Outreach". www.esrl.noaa.gov-US. Retrieved 2016-05-13.
{{cite web}}: CS1 maint: multiple names: authors list (link) - S2CID 42081518.
- S2CID 34373069.
- PMID 5237893.
- PMID 16657539.
- .
- .
- ^ .
- .
- .
- ^ .
- S2CID 206634401.
- .
- .
- ^ .
- ^ PMID 17601150.
- .
- ^ Hayes, John M. "An introduction to isotopic calculations." Woods Hole Oceanographic Institution, Woods Hole, MA 2543 (2004).
- .
- ^ "Origin of the Elements". www2.lbl.gov. Retrieved 2016-05-13.
- S2CID 205240340.
- PMID 21431084.
- ^ "Spin classification of particles". hyperphysics.phy-astr.gsu.edu. Retrieved 2016-05-13.
- ^ )
- ISBN 978-1891389504.
- PMID 9990946.
- doi:10.1063/1.447763.
- .
- ^ .
- .
- .
- .
- ^ "Mythical Carbocations?". chemistry.umeche.maine.edu. Archived from the original on 2015-10-25. Retrieved 2016-05-13.
- ^ .
- .
- ^ Modified by inserting the data from [Clog, Matthieu; Aubaud, Cyril; Cartigny, Pierre; Dosso, Laure (2013). "The hydrogen isotopic composition and water content of southern Pacific MORB: A reassessment of the D/H ratio of the depleted mantle Reservoir". Planetary Science Letters 381: 156–165.] and [Englebrecht A. C., Sachs J. P. (2005) Determination of sediment provenance at drift sites using hydrogen isotopes and unsaturation ratios in allkenones. Geochimina et Cosmochimica Acta, Vol. 69, No. 17, pp. 4253–4265] on the map from http://waterisotopes.org
- S2CID 54747800.
- ^ Englebrecht, A.C. & Sachs, J.P. (2005) Determination of sediment provenance at drift sites using hydrogen isotopes and unsaturation ratios in allkenones. Geochimina et Cosmochimica Acta, Vol. 69, No. 17, pp. 4253–4265
- ^ Modified by inserting data values on the map from Annu.Rev.Earth Planet.Sci.2010.38:161–187
- ^ .
- ^ Masson-Delmotte, V et al. (2008) A Review of Antarctic Surface Snow Isotopic Composition: Observations, Atmospheric Circulation, and Isotopic Modeling. American Meteorological Society. 3359–3387.
- ^ Modified by inserting the data from a paper [Frankenberg C. et al. (2009) Dynamic Processes Governing Lower-Tropospheric HDO/H2O Ratios as Observed from Space and Ground. Science 325, 1374–1377.] on the map from Annu.Rev.Earth Planet.Sci.2010.38:161–187
- S2CID 13043951.
- ^ White, J.W.C. & Gedzelman, S.D. (1984) The isotopic composition of atmospheric water vapor and the concurrent meteorological conditions. JGR: Atmospheres. Vol. 89. Issue D3. 4937–4939.
- ^ Sacese et al.
- ^ See Section 6. Hydrologic Cycle for more details.
- ^ Modified by inserting the data from waterisotopes.org on the map
- ^ a b "WaterIsotopes.org". wateriso.utah.edu.
- ^ a b Clark, Ian; Fritz, Peter. "Environmental Isotopes in Hydrogeology". mysite.science.uottawa.ca.
- ^ See Section 6.1. Isotopic fractionation in the hydrologic cycle for more details.
- ^ Modified by inserting the data values from waterisotopes.org on the map from Annu.Rev.Earth Planet.Sci.2010.38:161–187.
- .
- ^ a b See Section 7.1. Isotope hydrology for more details.
- ^ .
- ^ Sauer P. E. et al., (2000) Compound-specific D/H ratios of lipid biomarkers from sediments as a proxy for environmental and climatic conditions. Geochimica et Cosmochimica Acta. Vol. 65, No. 2, pp. 213–222.
- ^ Sachs J.P. (2014) Hydrogen Isotope Signatures in the Lipids of Phytoplankton. In: Holland H.D. and Turekian K.K. (eds.) Treatise on Geochemistry, Second Edition, vol. 12, pp. 79–94. Oxford: Elsevier.
- ^ a b c Sessions, A.L. (2002) Hydrogen isotope fractionation in lipids of the methane-oxidizing bacterium Methylococcus capsulatus. Geochimica et Cosmochimica Acta, 66. 22: 3955–3969.
- ^ See Section 7.5.3. Microbial metabolism for more details.
- ^ .
- ^ See Section 7.2.2.2. Plant leaf waxes for more details.
- ^ S2CID 12943614.
- ^ Sessions, A.L. et al. (1999) Fractionation of hydrogen isotopes in lipid biosynthesis. Organic Geochemistry. 30. 1193–1200
- PMID 11879039.
- ^ Hou et al., 2008
- ^ a b Soto, D. X., Wassenaar, L. I., Hobson, K. A., (2013) Stable hydrogen and oxygen isotopes in aquatic food webs are tracers of diet and provenance. Functional Ecology. Vol. 27. Issue. 2. 535–543.
- ^ See Section 7.3.3. Oil for more details.
- .
- ^ .
- ^ Modified by inserting the data from [Englebrecht, A. C. Sachs. J. P. (2005) Determination of sediment provenance at drift sites using hydrogen isotopes and unsaturation ratios in alkenones. Geochimica et Cosmochimica Acta. 69. 17:4253–4265.] on the map from Annu.Rev.Earth Planet.Sci.2010.38:161–187.
- ^ Englebrecht, A.C. & Sachs. J.P. (2005) Determination of sediment provenance at drift sites using hydrogen isotopes and unsaturation ratios in alkenones. Geochimica et Cosmochimica Acta. 69. 17:4253–4265.
- ^ See Section 7.2.2.3. Alkenones for more details.
- ^ Modified by inserting the data from papers by Redding (1980), Rigby and Smith (1981), and Smith (1983) on the map from Annu.Rev.Earth Planet.Sci.2010.38:161–187.
- ^ See Section 7.3.1. Kerogens and Coals for more details.
- .
- .
- S2CID 4317372.
- ^ See Section 7.3.2. Natural gas for more details.
- ^ .
- ^ References in a more detailed format are included in the main text.
- ^ Sheppard, S. M. F., Gilg, H. A. (1996) Stable Isotope Geochemistry of Clay Minerals. Clay Minerals. 31, 1–24.
- ^ Robert, F. 2006. Solar System Deuterium/Hydrogen Ratio. Meteorites and the Early Solar System II, D. S. Lauretta and H. Y. McSween Jr. (eds.), University of Arizona Press, Tucson, 943 pp., p.341-351
- ^ Pinti, Daniele (2011). Deuterium/Hydrogen Ratio, Encyclopedia of Astrobiology. Berlin Heidelberg: Springer-Verlag.
- ^ "Deuterium-to-hydrogen ratio in the Solar System".
- ^ McKeegan, K. D., Leshin, L. A. (2001) Stable Isotope Variations in Extraterrestrial Materials. Reviews in Mineralogy and Geochemistry. 43. (1)
- ^ PMID 16970194.
- ISBN 978-3-642-08960-2
- .
- .
- .
- .
- .
- .
- ^ Redrawn figure referred to http://www.uwyo.edu/sif/instrumentation/tcea.html
- PMID 25874646.
- PMID 23294482.
- PMID 25874646.
- PMID 19241415.
- .
- ^ .
- ^ PMID 10407302.
- .
- PMID 8686878.
- PMID 20962979.
- .
- PMID 21662727.
- PMID 19449320.
- )
- .
- ^ )
- ^ S2CID 12943614.
- )
- ^ .
- ^ PMID 26644588.
- S2CID 8646294.
- .
- S2CID 20650087.
- PMID 18346110.
- .
- ^ "Panorama Nu Instruments Ltd". nu-ins.com. Archived from the original on 2016-06-05. Retrieved 2016-05-14.
- .
- .
- ^ a b Ponton, Camilo. "Experiments constraining blocking temperatures of H isotope exchange in propane and ethane".
- ^ ISBN 978-0-19-511775-2.
- ^ Craig, Harmon; Gordon, Louis (1965). "Deuterium and oxygen 18 variations in the ocean and the marine atmosphere". Stable Isotopes in Oceanographic Studies and Paleotemperatures.
- .
- ^ )
- .
- S2CID 34373069.
- ^ .
- .
- .
- S2CID 128764777.
- S2CID 26237893.
- S2CID 30352947.
- PMID 24979768.
- )
- ^ .
- .
- S2CID 20985036.
- ^ S2CID 204993577.
- S2CID 128786034.
- S2CID 4368173.
- PMID 11141558.
- S2CID 9674822.
- S2CID 32636862.
- PMID 15190344.
- ^ S2CID 4304321.
- S2CID 206558186.
- doi:10.1038/364203a0.
- S2CID 129842509.
- S2CID 4303031.
- S2CID 25940751.
- .
- ^ .
- .
- ^ .
- .
- S2CID 4179399.
- ^ S2CID 42877790.
- ^ .
- S2CID 15976057.
- .
- S2CID 27533990.
- PMID 17210909.
- ^ .
- .
- ^ PMID 19617564.
- PMID 15231410.
- PMID 12737985.
- PMID 12538074.
- ^ .
- .
- .
- .
- PMID 21696403.
- .
- S2CID 11540486.
- S2CID 4397896.
- S2CID 7364713.
- .
- ^ doi:10.1130/g30215.1.
- ^ .
- ^ .
- .
- .
- ^ .
- ^ .
- ^ PMID 23650351.
- hdl:1912/3454.
- ^ .
- .
- .
- ^ .
- .
- .
- .
- doi:10.1130/g20394.1.
- .
- .
- .
- .
- ^ .
- .
- ^ .
- ^ .
- .
- .
- S2CID 4317372.
- .
- ^ S2CID 140549821.
- .
- .
- PMID 23683048.
- ISBN 9780080525280.
- .
- .
- S2CID 31569235.
- ^ S2CID 206634401.
- Bibcode:2014AGUFMPP54A..06C.
- .
- .
- ^ .
- .
- .
- S2CID 58905575.
- .
- ^ S2CID 4367205.
- PMID 19585154.
- PMID 17210909.
- ^ .
- ^ Craig, Harmon; Gordon, Louis Irwin (1965-01-01). Deuterium and Oxygen 18 Variations in the Ocean and the Marine Atmosphere. Consiglio nazionale delle richerche, Laboratorio de geologia nucleare.
- PMID 10444100.
- .
- ^ PMID 20516485.
- S2CID 10231727.
- PMID 23926146.
- PMID 25337458.
- ^ .
- ISBN 9781483289830.
- doi:10.1644/BRG-202.
- ^ .
- PMID 10393937.
- PMID 22470423.
- .
- S2CID 12098584.
- .
- ^ PMID 23713674.
- .
- .
- PMID 12899888.
- .
- .
- PMID 21768331.
- .
- PMID 11878389.
- PMID 12026973.
- PMID 11571192.
- .
- PMID 12075805.
- PMID 14750739.
- PMID 15137854.
- PMID 15969525.
- PMID 16190651.
- PMID 19462405.
- S2CID 206911124.
- PMID 15030876.
- PMID 15967309.
- PMID 15925470.
- S2CID 25064362.
- PMID 18585334.
- PMID 17920397.
- S2CID 7161041.
- PMID 16220464.
- PMID 10855958.
- PMID 18299562.
- ISBN 9780080983004.