
Illinois's 1st congressional district
| Illinois's 1st congressional district | |||
|---|---|---|---|
Interactive map of district boundaries since January 3, 2023 | |||
| Representative |
| ||
| Area | 621.6 sq mi (1,610 km2) | ||
| Population (2022) | 728,550 | ||
| Median household income | $64,107[1] | ||
| Ethnicity |
| ||
| Cook PVI | D+20[2] | ||
.svg)

Illinois's first congressional district is a congressional district in the U.S. state of Illinois. Based in Cook County, the district includes much of the South Side of Chicago and continues southwest to Joliet.
From 2003 to early 2013 it extended into the city's
The 1st is a
The district is currently represented by Jonathan Jackson who was elected to succeed longtime incumbent Bobby Rush in 2022.[3]
Historical boundaries
The district was adjacent to the 2nd district to the east and south, the 7th district to the north, and the 3rd and 13th districts to the west, and also bordered the 11th district at its southwest corner. The district's northeast border followed Lake Michigan's shoreline for almost a mile.
The district was created following the
The current 1st district has a
While successive redistrictings have given the district a larger percentage of white voters, it is still one of the most reliably Democratic districts in the country; with a
Geography
Based in Chicago, the district includes the neighborhoods of
The district's area south of 95th Street is almost entirely west of Interstate 57. The district includes the municipalities of Crestwood, Evergreen Park, Midlothian, Posen and Robbins, nearly all of Alsip, Blue Island and Oak Forest, parts of Calumet Park, Dixmoor, Markham, Orland Hills, Orland Park, Palos Heights, Tinley Park and Worth, and some small sections of Country Club Hills and Riverdale.
Demographics
In the twentieth century after the Great Migration from the South and concentration of blacks on the South Side due to de facto residential segregation, the district became the nation's first with a black-majority population. Since the 1920s, it has included the central area of Chicago's South Side African-American community. Over 85% of the district's residents were black during the period from the 1950s through the 1980s, but redistricting since that time – which redrew the district lines with the goal of maintaining three Chicago districts with black populations exceeding 60% – has reduced the percentage of black residents in the district to 70% in the 1990s. The current figure is 65%. Outward migration has caused the South Side's population to decrease over the years, and the district was expanded geographically to the southwest to gain residents, particularly as the state's congressional delegation has been reduced in numbers due to population changes and reapportionment. The district, which covered only nine square miles in the 1950s, is now more than ten times that size. Nearly half its current area was added for the 2000s.
The district's population dropped by 27% in the 1950s,
The Kenwood-Hyde Park area for several decades had a significant
As of 2000, 38% of the district's adult residents were married.
Redistricting
2011 cycle
In 2011, following the 2010 census, the state legislature redistricted. It expanded the district to cover parts of Cook and Will Counties. After redistricting, all or parts of Alsip, Blue Island, Calumet Park, Chicago, Country Club Hills, Crestwood, Dixmoor, Elwood, Evergreen Park, Frankfort, Frankfort Square, Harvey, Manhattan, Markham, Merrionette Park, Midlothian, Mokena, New Lenox, Oak Forest, Oak Lawn, Orland Hills, Orland Park, Palos Heights, Posen, Riverdale, Robbins, Tinley Park, and Worth are included.[14] The representative for these districts were elected in the 2012 primary and general elections, and the boundaries became effective on January 3, 2013.
2021 cycle
| # | County | Seat | Population |
|---|---|---|---|
| 31 | Cook | Chicago
|
5,173,146 |
| 91 | Kankakee | Kankakee | 106,601 |
| 197 | Will | Joliet | 697,252 |
As of the 2020 redistricting, the district will still be centered primarily around the
County.The 1st district takes in the
Outside of the Chicago city limits, the district takes in the Cook County communities of Midlothian, Posen, and Robbins; most of Blue Island; the south portion of Lemont; and parts of Oak Forest, Orland Park, Crestwood, and Beverly.
Will County is split between this district, the
Kankakee County is split between this district and the 2nd district. They are partitioned by North 5000E Rd, East 6000N Rd, Cardinal Drive, Durham St, East Armour Rd, East Marsile St, Bisallion Ave, and the Kankakee River. The 1st district takes in the municipalities of Manteno; half of Bourbannais; and part of Bradley.
Presidential election results
- This table indicates how the district has voted in U.S. presidential elections; election results reflect voting in the district as it was configured at the time of the election, not as it is configured today. The candidate who received the most votes in the district is listed first; the candidate who won the election nationally is in CAPS, and the candidate who won the state of Illinois is indicated with a †.
| Election | District winner | Runner up | Other candidates |
|---|---|---|---|
| 1852[15] | Scott (W), 6,992 (42%) | PIERCE† (D), 6,948 (41%) | Hale (Free Soil), 2,885 (17%) |
| 1856[15] | Frémont (R), 18,247 (73%) | BUCHANAN† (D), 5,991 (24%) | Fillmore (American), 677 (3%) |
| 1860[15] | LINCOLN† (R), 21,436 (70%) | Douglas (D), 8,940 (29%) | Bell (Constitutional Union), 99 (0.3%); Breckinridge (D), 62 (0.2%) |
| 1864[15] | LINCOLN† (R), 18,667 (81%) | McClellan (D), 4,351 (19%) | |
| 1868[15] | GRANT† (R), 27,527 (59%) | Seymour (D), 19,104 (41%) | |
| 1872 ... 1948 |
[data missing] | ||
| 1952[16] | Stevenson (D), 99,224 (75%) | EISENHOWER† (R), 33,805 (25%) | |
| 1956[16] | Stevenson (D), 68,266 (64%) | EISENHOWER† (R), 38,827 (36%) | |
| 1960[17] | KENNEDY† (D), 75,938 (77.80%) | Nixon (R), 21,660 (22.19%)} | |
| 1964[18] | JOHNSON† (D), 150,953 (84.91%) | Goldwater (R), 26,823 (15.08%) | |
| 1968[19] | Humphrey (D), 138,835 (93%) | NIXON† (R), 10,081 (7%) | Wallace (AIP), 1,010 (1%) |
| 1972[20] | McGovern (D), 145,003 (90%) | NIXON† (R), 16,998 (10%) | |
| 1976[21] | CARTER (D), 130,882 (90%) | Ford† (R), 13,817 (10%) | |
| 1980[22] | Carter (D), 128,426 (91%) | REAGAN† (R), 6,633 (5%) | Indep. ), 3,092 (2%)
|
| 1984[23] | Mondale (D), 196,351 (95%) | REAGAN† (R), 10,153 (5%) | |
| 1988[24] | Dukakis (D), 174,793 (95%) | G. H. W. BUSH† (R), 7,168 (4%) | |
| 1992[25] | CLINTON† (D), 214,104 (81%) | G. H. W. Bush (R), 32,803 (12%) | Perot (Indep.), 17,355 (7%) |
| 1996[26] | CLINTON† (D), 179,767 (85%) | Dole (R), 22,914 (11%) | Perot (Reform), 6,378 (3%) |
| 2000[27] | Gore† (D), 194,432 (87%) | G. W. BUSH (R), 24,276 (11%) | Green ), 2,867 (1%)
|
| 2004[28] | Kerry† (D), 234,086 (83%) | G. W. BUSH (R), 47,533 (17%) | |
| 2008[7] | OBAMA† (D) 287,240 (81%) | McCain (R) 66,840 (19%) | |
| 2012[7] | OBAMA† (D) 262,836 (79%) | Romney (R) 67,557 (20%) | |
| 2016[7] | Clinton† (D) 262,836 (79%) | TRUMP (R) 67,557 (20%) | |
| 2020[7] | BIDEN† (D) 246,946 (74%) | Trump (R) 82,594 (25%) | |
Results from recent statewide elections
- This table indicates how the district has voted in recent statewide elections; election results reflect voting in the district as it is currently configured, not necessarily as it was at the time of these elections.
| Year | Office | Results |
|---|---|---|
| 2016 | President | Hillary Clinton 71.9% – Donald Trump 24.0% |
| Senate | Tammy Duckworth 71.9% – Mark Kirk 23.5% | |
| 2018 | Governor | J. B. Pritzker 71.2% – Bruce Rauner 24.4% |
Attorney General
|
Kwame Raoul 71.1% – Erika Harold 26.9% | |
Secretary of State
|
Jesse White 80.1% – Jason Helland 18.0% | |
| 2020 | President | Joe Biden 70.5% – Donald Trump 28.1% |
| Senate | Dick Durbin 61.1% – Mark Curran 25.2% | |
| 2022 | Senate | Kathy Salvi 29.2%
|
| Governor | J. B. Pritzker 67.7% – Darren Bailey 30.0% | |
| Attorney General | Kwame Raoul 68.2% – Tom DeVore 30.1% | |
| Secretary of State | Alexi Giannoulias 68.2% – Dan Brady 29.9% |
Economy
The departure of the
Hospitals in the district include
Local educational institutions include the
In addition to Washington Park and those sites associated with the University of Chicago and IIT, district locations on the National Register of Historic Places include:
|
|
Politics
Democrats routinely dominate politics in the district, with the main focus of competition being the party primary. Only twice since 1966 has a Republican candidate for Congress received over 20% of the vote,[29] and the Democratic nominee has topped 80% in every presidential race during that time. The district's expansion into the suburbs in the 1990s has incorporated a population that has voted Republican more often; Republican support has passed the 10% mark, and George W. Bush received 17% of the vote here in 2004. His was the best showing by a Republican presidential candidate in the district in over 40 years.
The district has since the early 1970s elected representatives who dissented from the city's Democratic establishment.
Stewart served only one term and lost the 1980 Democratic primary to reform candidate
.jpg)
Rush was a co-founder of the Illinois
In Congress, Rush focused on
Prominent representatives
| Representative | Notes |
|---|---|
,_Governor_of_Illinois.jpg) John Reynolds |
Associate Justice of the Illinois Supreme Court (1818–1824) (1830–1834)
Elected the 4th governor of Illinois |
 William Henry Bissell |
Elected the 11th governor of Illinois (1857–1860) |
 John Wentworth |
Elected the 21st mayor of Chicago (1860–1861) |
 Elihu B. Washburne |
Served as Dean of the U.S. House of Representatives (1863–1869) Appointed the 25th U.S. Secretary of State (1869) Appointed the U.S. minister to France (1869–1877) |
 John Blake Rice |
Elected the 24th mayor of Chicago (1865–1869) |
 Norman B. Judd |
Appointed the U.S. envoy to Prussia (1867–1871) |
 Charles B. Farwell |
Elected U.S. Senator from Illinois (1887–1891) |
_in_1916_(cropped).jpg) James Robert Mann |
Served as U.S. House Minority Leader (1911–1919) |
 William L. Dawson |
Served as a first lieutenant in the U.S. Army during World War I (1917–1919) First African-American to chair a congressional committee. |
 Ralph Metcalfe |
Olympian (1932, 1936) Served as a first lieutenant in the U.S. Army during World War II (1942–1945) |
 Harold Washington |
Elected the 51st mayor of Chicago (1983–1987) First African-American mayor of Chicago |
List of members representing the district
| Member | Party | Years | Cong ress |
Electoral history | District location |
|---|---|---|---|---|---|
| District created March 4, 1833 | |||||
| Charles Slade (Carlyle) |
Jacksonian
|
March 4, 1833 – July 26, 1834 |
23rd | Elected in 1832 .Died. |
1833–1843 Included the sixteen counties in the state's southwestern section: Alexander, Bond, Clinton, Franklin, Gallatin, Jackson, Johnson, Macoupin, Madison, Monroe, Perry, Pope, Randolph, St. Clair, Union and Washington counties (five additional counties were later created within this area).[4] |
| Vacant | July 26, 1834 – December 1, 1834 |
23rd | |||
 John Reynolds (Belleville) |
Jacksonian
|
December 1, 1834 – March 3, 1837 |
23rd 24th |
Re-elected in 1834 .Lost re-election. | |
 Adam W. Snyder (Belleville) |
Democratic | March 4, 1837 – March 3, 1839 |
25th | Elected in 1836 .Retired. | |
John Reynolds (Belleville) |
Democratic | March 4, 1839 – March 3, 1843 |
26th 27th |
Re-elected in 1840. ]
[data missing | |
Robert Smith )
(Alton |
Democratic | March 4, 1843 – March 3, 1847 |
28th 29th |
Re-elected in 1846. ]
[data missing |
1843–1853 Reduced in size, and now included eleven counties: Alexander, Bond, Clinton, Jackson, Madison, Monroe, Perry, Randolph, St. Clair, Union and Washington counties.[5] |
Independent Democratic
|
March 4, 1847 – March 3, 1849 |
30th | |||
William H. Bissell (Belleville) |
Democratic | March 4, 1849 – March 3, 1853 |
31st 32nd |
Re-elected in 1850. ]
[data missing | |
 Elihu B. Washburne (Galena) |
Whig | March 4, 1853 – March 3, 1855 |
33rd | Re-elected in 1860. ]
[data missing |
1853–1863 Shifted north to cover the eight counties along the state's northern edge: Boone, Carroll, Jo Daviess, Lake, McHenry, Ogle, Stephenson and Winnebago counties.[6] Ulysses S. Grant was a district resident in 1860–61 during the period when he was out of the Army, working in his family's store in Galena, and he became acquainted with Congressman Elihu B. Washburne; Washburne became his political mentor and sponsor, and eventually became Grant's first Secretary of State. |
| Republican | March 4, 1855 – March 3, 1863 |
34th 35th 36th 37th | |||
Chicago )
|
Republican | March 4, 1863 – March 3, 1865 |
38th | Elected in 1862. ]
[data missing |
1863–1873 During this decade, beginning during the 1864 House election as the Democratic candidate.[40] Later during this period, the district was devastated by the Great Chicago Fire in October 1871.
|
Chicago )
|
Republican | March 4, 1865 – March 3, 1867 |
39th | Elected in 1864. ]
[data missing | |
Chicago )
|
Republican | March 4, 1867 – March 3, 1871 |
40th 41st |
Re-elected in 1868 .Retired. | |
Chicago )
|
Republican | March 4, 1871 – March 3, 1873 |
42nd | Elected in 1870. ]
[data missing | |
Chicago )
|
Republican | March 4, 1873 – December 17, 1874 |
43rd | Elected in 1872 .Retired and then died. |
1873–1883 Restructured and now included DuPage County, the thirteen townships comprising the southern half of Cook County (Bloom, Bremen, Calumet, Hyde Park, Lake, Lemont, Lyons, Orland, Palos, Rich, Riverside, Thornton, Worth), and the entire South Side and part of the West side of Chicago. The Chicago portion of the district began downtown and extended south to 39th Street (now Pershing Road) east of the Chicago River and south of the river and the Illinois and Michigan Canal, with its western boundary being Western Avenue; on the west side, the district included the area between 16th Street on the north and the river and canal on the south, with the city's western boundary then being Crawford Avenue (now Pulaski Road).[41] |
| Vacant | December 17, 1874 – February 1, 1875 | ||||
Chicago )
|
Democratic | February 1, 1875 – March 3, 1877 |
43rd 44th |
Re-elected in 1874 .Retired. | |
Chicago )
|
Republican | March 4, 1877 – March 3, 1883 |
45th 46th 47th |
Re-elected in 1880 .Lost renomination. | |
Chicago )
|
Republican | March 4, 1883 – March 3, 1889 |
48th 49th 50th |
Re-elected in 1886 .Retired. |
1883–1895 Remained identical to its previous configuration, except that it no longer included DuPage County or the portion of Chicago west of Clark Street between 16th and 39th Streets.[42] Illinois gained two additional representatives following the 1890 census, but they were elected on an at-large basis for the 1893–1895 term before redistricting occurred, and the previous decade's districting remained in effect.[43] |
Chicago )
|
Republican | March 4, 1889 – March 3, 1893 |
51st 52nd |
Re-elected in 1890 .Retired. | |
Chicago )
|
Republican | March 4, 1893 – March 3, 1897 |
53rd 54th |
Re-elected in 1894 .Retired. | |
| 1895–1903 Included the seven townships in southeastern Cook County (Bloom, Bremen, Calumet, Orland, Rich, Thornton, Worth), and the portion of Chicago's South Side bordered on the north by 26th Street, and on the west by Wentworth Avenue from 26th to 39th Streets and by State Street from 39th to 63rd Streets before following 63rd Street west to the city's border with Lyons Township (then at Cicero Avenue).[44] | |||||
Chicago )
|
Republican | March 4, 1897 – March 3, 1903 |
55th 56th 57th |
Re-elected in 1900. .
Redistricted to the 2nd district | |
Chicago )
|
Democratic | March 4, 1903 – March 3, 1905 |
58th | Elected in 1902 .Retired. |
1903–1949 Confined to the city of Chicago for the first time, and included downtown and the area east of Wentworth to 43rd Street, also reaching west to include 1928, Oscar De Priest became the first African American elected to Congress in the 20th century.
|
Chicago )
|
Republican | March 4, 1905 – April 27, 1928 |
59th 60th 61st 62nd 63rd 64th 65th 66th 67th 68th 69th 70th |
Re-elected in 1926 .Died. | |
| Vacant | April 27, 1928 – March 3, 1929 |
70th | |||
Chicago )
|
Republican | March 4, 1929 – January 3, 1935 |
71st 72nd 73rd |
Re-elected in 1932 .Lost re-election. | |
Chicago )
|
Democratic | January 3, 1935 – January 3, 1943 |
74th 75th 76th 77th |
Re-elected in 1940 .Retired. | |
Chicago )
|
Democratic | January 3, 1943 – November 9, 1970 |
78th 79th 80th 81st 82nd 83rd 84th 85th 86th 87th 88th 89th 90th 91st |
Re-elected in 1970 .Died. | |
| 1949–1963 Included that part of Chicago bounded on the north by the river; on the east by the lake to Pershing Road and by Cottage Grove Avenue from Pershing to 71st Street and South Chicago Avenue; on the south by Marquette Road from State Street to South Chicago Avenue, following that southeast to 71st and Cottage Grove; and on the west by Wallace Street (from the river to 25th Street), Canal Street (25th to 31st Street), Wentworth (31st to 43rd Street), the railroad between State and Wentworth (43rd to 59th Street) and State Street (59th to Marquette).[47] The same boundaries were maintained in the redistricting after 1950.[48] | |||||
| 1963–1967 Included that part of Chicago between 31st and 99th Streets bounded on the west by Wentworth (31st to Garfield Boulevard), the railroad 1/4-mile east of Halsted (Garfield to 59th), Halsted (59th to 63rd), State Street (63rd to 83rd) and Stewart Avenue (83rd to 99th), and bounded on the east by the lake (31st to 46th), Cottage Grove (46th to 65th) and Stony Island Avenue (65th to 99th).[49] | |||||
| 1967–1973 Additional redistricting for the 1967–1969 term. All of the district's previous territory was retained, but it was extended further north as far as Cermak Road, with its western boundary being the railroad between State and Wentworth (Cermak to 28th Street) and then Wentworth (28th to Garfield). In addition, a small area east of Woodlawn Avenue between 46th and 47th Streets was added.[50] | |||||
| Vacant | November 9, 1970 – January 3, 1971 |
91st | |||
Chicago )
|
Democratic | January 3, 1971 – October 10, 1978 |
92nd 93rd 94th 95th |
Re-elected in 1976 .Died. | |
| 1973–1983 Included that part of Chicago between 31st and 103rd Streets bounded on the west by King Drive (31st to 35th), State (35th to Pershing), the railroad 1/4-mile west of State (Pershing to Garfield), King Drive (Garfield to Marquette), Yale Avenue (Marquette to 69th), Harvard Avenue (69th to 70th), Stewart (70th to 71st), Halsted (71st to Calumet Expressway (75th to 103rd, with minor variation at 95th).[51]
| |||||
| Vacant | October 10, 1978 – January 3, 1979 |
95th | |||
Chicago )
|
Democratic | January 3, 1979 – January 3, 1981 |
96th | Elected in 1978 .Lost renomination. | |
Chicago )
|
Democratic | January 3, 1981 – April 30, 1983 |
97th 98th |
Re-elected in 1982. .
Resigned to become Mayor of Chicago | |
| 1983–1993 The only remaining district entirely within the city of Chicago, and included that area between Cermak Road and 103rd Street bounded on the west by Federal Street (Cermak to 25th), the railroad 1/4-mile west of State (25th to 35th), the railroad 1/2-mile east of Halsted (35th to 42nd and 43rd to 47th), Stewart (42nd to 43rd), Morgan Street (47th to 48th), Racine Avenue (48th to Garfield), Peoria Street (Garfield to 56th), Green Street (56th to 57th) and Halsted (57th to 103rd), and on the east by the lake (Cermak to 73rd) and Yates (73rd to 103rd).[52] | |||||
| Vacant | April 30, 1983 – August 23, 1983 |
98th | |||
Chicago )
|
Democratic | August 23, 1983 – January 3, 1993 |
98th 99th 100th 101st 102nd |
Re-elected in 1990 .Lost renomination. | |
Chicago )
|
Democratic | January 3, 1993 – January 3, 2023 |
103rd 104th 105th 106th 107th 108th 109th 110th 111th 112th 113th 114th 115th 116th 117th |
Re-elected in 2002. .Re-elected in 2004. Re-elected in 2006. Re-elected in 2008. Re-elected in 2010. Re-elected in 2012. Re-elected in 2014. Re-elected in 2016. Re-elected in 2018. Re-elected in 2020 Retired. |
1993–2003 Expanded into the suburbs for the first time in 90 years, increasing its total area from 32 to 56 square miles (150 km2). It now included: the Chicago communities of Washington Park, excepting the area northwest of 57th and King Drive; the part of Grand Boulevard north of 43rd Street, as well as most of the area east of Vincennes Avenue; the portion of Armour Square southeast of 35th Street and Princeton Avenue; most of Englewood north of 63rd or east of Halsted; the portion of West Englewood north of 63rd; most of New City southwest of 49th and May Streets; most of Brighton Park southeast of 40th and Kedzie Avenue; portions of Gage Park east of Kedzie, most of Chicago Lawn east of Kedzie, and the portion of Ashburn east of Kedzie; Beverly, excepting the area southeast of 103rd and Prospect Avenue; and most of Morgan Park west of Vincennes. In the suburbs, the district included the villages of Evergreen Park and Merrionette Park, the portion of Alsip east of Cicero Avenue, the portion of Blue Island in Worth Township north of the Calumet Sag Channel, and, with minor variations, the portion of Oak Lawn southeast of 101st and Cicero.[53]
|
2003–2013
| |||||
2013–2023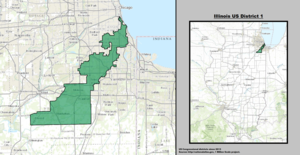
| |||||
 Jonathan Jackson (Chicago) |
Democratic | January 3, 2023 – present |
118th | Elected in 2022. | 2023–present_(new_version).svg)
|
Election results
1832–1840
| Party | Candidate | Votes | % | |
|---|---|---|---|---|
| Democratic | Charles Slade | 2,470 | 31.28 | |
| Democratic-Republican | Ninian Edwards | 2,078 | 26.31 | |
| Democratic | Sidney Breese | 1,770 | 22.41 | |
| Total votes | 7,897 | 100.0 | ||
| Party | Candidate | Votes | % | |
|---|---|---|---|---|
| Democratic | John Reynolds | 4,136 | 41.98 | |
| Democratic | Adam W. Snyder | 3,723 | 37.79 | |
| Unknown | Edward Humphreys | 1,990 | 20.20 | |
| Write-in | 3 | 0.03 | ||
| Total votes | 9,852 | 100.0 | ||
| Party | Candidate | Votes | % | |
|---|---|---|---|---|
| Democratic | John Reynolds | 1,721 | 47.99 | |
| Democratic-Republican | Pierre Menard | 871 | 24.29 | |
| Unknown | William Orr | 501 | 13.97 | |
| Unknown | Henry L. Webb | 490 | 13.66 | |
| Write-in | 3 | 0.08 | ||
| Total votes | 3,586 | 100.0 | ||
| Party | Candidate | Votes | % | |
|---|---|---|---|---|
| Democratic | Adam W. Snyder | 4,552 | 40.06 | |
| Democratic | John Reynolds (incumbent) | 4,441 | 39.08 | |
| Whig | William J. Gatewood | 2,370 | 20.86 | |
| Total votes | 11,363 | 100.0 | ||
| Party | Candidate | Votes | % | ±% | |
|---|---|---|---|---|---|
| Democratic | John Reynolds | 8,032 | 61.16 | +22.08% | |
| Whig | John Hogan | 5100 | 38.84 | +17.98% | |
| Total votes | 13,132 | 100.0 | |||
1841–1850
| Party | Candidate | Votes | % | ±% | |
|---|---|---|---|---|---|
| Democratic | John Reynolds (incumbent) | 8,046 | 59.44 | -1.72% | |
| Whig | Henry L. Webb | 5,313 | 39.25 | +0.41% | |
| John Tyler Supporter | Stephen R. Rowan | 171 | 1.26 | N/A | |
| Write-in | 14 | 0.10 | N/A | ||
| Total votes | 13,537 | 100.0 | |||
| Party | Candidate | Votes | % | ±% | |
|---|---|---|---|---|---|
| Democratic | Robert Smith
|
7,347 | 56.11 | -3.33% | |
| Whig | James L. D. Morrison | 5,568 | 42.53 | +3.28% | |
| Liberty | Robert W. Marshall | 176 | 1.34 | N/A | |
| Write-in | 2 | 0.02 | -0.08% | ||
| Total votes | 13,093 | 100.0 | |||
| Party | Candidate | Votes | % | ±% | |
|---|---|---|---|---|---|
| Democratic | Robert Smith (incumbent )
|
7,966 | 64.65 | +8.54% | |
| Democratic | John Reynolds | 4,146 | 33.65 | N/A | |
| Liberty | Robert W. Marshall | 191 | 1.55 | +0.21% | |
| Write-in | 36 | 0.29 | +0.27% | ||
| Total votes | 12,321 | 100.0 | |||
| Party | Candidate | Votes | % | ±% | |
|---|---|---|---|---|---|
| Independent Democrat | Robert Smith (incumbent )
|
7,068 | 58.13 | -6.52% | |
| Democratic | Lyman Trumbull | 5,019 | 41.28 | N/A | |
| Liberty | B. Marshall | 62 | 0.51 | -1.04% | |
| Write-in | 10 | 0.08 | -0.21% | ||
| Total votes | 12,159 | 100.0 | |||
| Party | Candidate | Votes | % | ±% | |
|---|---|---|---|---|---|
| Democratic | William H. Bissell | 9,892 | 97.74 | +56.46% | |
| Liberty | Charles W. Hunter | 229 | 2.26 | +1.75% | |
| Total votes | 10,121 | 100.0 | |||
| Party | Candidate | Votes | % | ±% | |
|---|---|---|---|---|---|
| Democratic | William H. Bissell (incumbent) | 12,841 | 99.99 | +2.25% | |
| Write-in | 1 | 0.01 | N/A | ||
| Total votes | 100.0 | ||||
1852–1860
| Party | Candidate | Votes | % | ±% | |
|---|---|---|---|---|---|
| Whig | Elihu B. Washburne | 7,392 | 43.93 | N/A | |
| Democratic | Thompson Campbell | 7,106 | 42.23 | -57.76% | |
| Free Soil | Newman Campbell | 2,245 | 13.34 | N/A | |
| Write-in | 85 | 0.51 | +0.50% | ||
| Total votes | 16,828 | 100.0 | |||
| Party | Candidate | Votes | % | ±% | |
|---|---|---|---|---|---|
| Republican | Elihu B. Washburne (incumbent) | 8,372 | 69.33 | +25.40% | |
| Democratic | William M. Jackson | 2,776 | 22.99 | -19.24% | |
| Anti-Nebraska | E. P. Ferry | 927 | 7.68 | N/A | |
| Total votes | 12,075 | 100.0 | |||
| Party | Candidate | Votes | % | ±% | |
|---|---|---|---|---|---|
| Republican | Elihu B. Washburne (incumbent) | 18,070 | 72.61 | +3.28% | |
| Democratic | Richard S. Molony | 6,227 | 25.02 | +2.03% | |
| Unknown | Elisha B. Washburne | 331 | 1.33 | N/A | |
| Know Nothing | B. D. Eastman | 257 | 1.03 | N/A | |
| Total votes | 24,885 | 100.0 | |||
| Party | Candidate | Votes | % | ±% | |
|---|---|---|---|---|---|
| Republican | Elihu B. Washburne (incumbent) | 15,811 | 69.84 | -2.77% | |
| Democratic | Hiram Bright | 6,457 | 28.52 | +3.50% | |
| Democratic Party (Anti-Lecompton) | Richard H. Jackson | 370 | 1.63 | N/A | |
| Total votes | 22,638 | 100.0 | |||
| Party | Candidate | Votes | % | ±% | |
|---|---|---|---|---|---|
| Republican | Elihu B. Washburne (incumbent) | 21,436 | 70.56 | +0.72% | |
| Democratic | Theodore A. C. Beard | 8,929 | 29.39 | +0.87% | |
| Write-in | 14 | 0.05 | N/A | ||
| Total votes | 30,379 | 100.0 | |||
1862–1870
| Party | Candidate | Votes | % | ±% | |
|---|---|---|---|---|---|
| Republican | Isaac N. Arnold | 10,025 | 54.45 | -16.11% | |
| Democratic | Francis Cornwall Sherman | 8,387 | 45.55 | +16.16% | |
| Total votes | 18,412 | 100.0 | |||
| Party | Candidate | Votes | % | ±% | |
|---|---|---|---|---|---|
| National Union | John Wentworth | 18,557 | 56.52 | +2.07% | |
| Democratic | Cyrus McCormick | 14,277 | 43.48 | -2.07% | |
| Total votes | 32,834 | 100.0 | |||
| Party | Candidate | Votes | % | ±% | |
|---|---|---|---|---|---|
| Republican | Norman B. Judd | 15,247 | 72.90 | +16.38% | |
| Democratic | Martin R. M. Wallace | 5,667 | 27.10 | -16.38% | |
| Total votes | 41,828 | 100.0 | |||
| Party | Candidate | Votes | % | ±% | |
|---|---|---|---|---|---|
| Republican | Norman B. Judd (incumbent) | 27,414 | 58.77 | -14.13% | |
| Democratic | Martin R. M. Wallace | 19,233 | 41.23 | +14.13% | |
| Total votes | 46,647 | 100.0 | |||
| Party | Candidate | Votes | % | ±% | |
|---|---|---|---|---|---|
| Republican | Charles B. Farwell | 40,684 | 57.52 | -1.25% | |
| Democratic | John Wentworth | 15,025 | 42.48 | +1.25% | |
| Total votes | 70,734 | 100.0 | |||
1872–1880
| Party | Candidate | Votes | % | ±% | |
|---|---|---|---|---|---|
| Republican | John Blake Rice | 12,870 | 64.01 | +6.49% | |
| Liberal Republican | Lucien B. Otis | 7,235 | 35.99 | N/A | |
| Total votes | 20,105 | 100.0 | |||
| Party | Candidate | Votes | % | ±% | |
|---|---|---|---|---|---|
| Democratic | Bernard G. Caulfield | 10,211 | 51.02 | N/A | |
| Republican | Sidney Smith | 9,803 | 48.98 | -15.03% | |
| Total votes | 20,014 | 100.0 | |||
| Party | Candidate | Votes | % | ±% | |
|---|---|---|---|---|---|
| Democratic | Bernard G. Caulfield | 3,461 | 81.96 | +30.94% | |
| Unknown | H. Eddy | 454 | 10.75 | N/A | |
| Unknown | Henry Vallettee | 308 | 7.29 | N/A | |
| Total votes | 4,223 | 100.0 | |||
| Party | Candidate | Votes | % | ±% | |
|---|---|---|---|---|---|
| Republican | William Aldrich | 16,587 | 53.21 | N/A | |
| Democratic | John Randolph Hoxie | 14,101 | 45.23 | -36.73% | |
| Greenback | George S. Bowen | 486 | 1.56 | N/A | |
| Total votes | 31,174 | 100.0 | |||
| Party | Candidate | Votes | % | ±% | |
|---|---|---|---|---|---|
| Republican | William Aldrich (incumbent) | 12,165 | 51.84 | -1.37% | |
| Democratic | James Rood Doolittle
|
7,136 | 30.41 | -14.82% | |
| Socialist Labor | John McAuliff | 2,322 | 9.90 | N/A | |
| Greenback | William V. Barr | 1,844 | 7.86 | +6.30% | |
| Total votes | 23,467 | 100.0 | |||
| Party | Candidate | Votes | % | ±% | |
|---|---|---|---|---|---|
| Republican | William Aldrich (incumbent) | 22,307 | 53.79 | +1.95% | |
| Democratic | John Mattocks | 18,024 | 43.47 | +13.06% | |
| Socialist Labor | J. J. Altpeter | 605 | 1.46 | -8.44% | |
| Greenback | Richard Powers | 532 | 1.28 | -6.58% | |
| Total votes | 41,468 | 100.0 | |||
1882–1890
| Party | Candidate | Votes | % | ±% | |
|---|---|---|---|---|---|
| Republican | Ransom W. Dunham | 11,571 | 50.86 | -2.93% | |
| Democratic | John W. Downes | 10,534 | 46.31 | +2.84% | |
| Greenback | Alonzo J. Glover | 644 | 2.83 | +1.55% | |
| Total votes | 22,749 | 100.0 | |||
| Party | Candidate | Votes | % | ±% | |
|---|---|---|---|---|---|
| Republican | Ransom W. Dunham (incumbent) | 20,245 | 56.73 | +5.87% | |
| Democratic | William M. Tilden | 14,655 | 41.06 | -5.25% | |
| Greenback | Jno. B. Clark | 501 | 1.40 | -1.43% | |
| Unknown | William B. Clark | 288 | 0.81 | N/A | |
| Total votes | 35,689 | 100.0 | |||
| Party | Candidate | Votes | % | ±% | |
|---|---|---|---|---|---|
| Republican | Ransom W. Dunham (incumbent) | 12,321 | 46.89 | -9.84% | |
| Democratic | Edgar Terhune | 7,258 | 27.62 | -13.44% | |
| Labor | Harvey Sheldon, Jr. | 6,358 | 24.20 | N/A | |
| Prohibition | George C. Christian | 337 | 1.28 | N/A | |
| Total votes | 26,274 | 100.0 | |||
| Party | Candidate | Votes | % | ±% | |
|---|---|---|---|---|---|
| Republican | Abner Taylor | 26,553 | 52.86 | +5.97% | |
| Democratic | James F. Todd | 22,697 | 45.19 | +17.57% | |
| Prohibition | Harry S. Taylor | 981 | 1.95 | +0.67% | |
| Total votes | 50,231 | 100.0 | |||
| Party | Candidate | Votes | % | ±% | |
|---|---|---|---|---|---|
| Republican | Abner Taylor (incumbent) | 22,235 | 49.95 | -2.91% | |
| Democratic | William G. Ewing | 21,796 | 48.96 | +3.77% | |
| Prohibition | Isaac H. Pedrick | 483 | 1.09 | -0.86% | |
| Total votes | 44,514 | 100.0 | |||
1892–1900
| Party | Candidate | Votes | % | ±% | |
|---|---|---|---|---|---|
| Republican | J. Frank Aldrich | 39,726 | 49.68 | -0.27% | |
| Democratic | Edwin B. Smith | 37,904 | 47.40 | -1.56% | |
| Prohibition | Winfield S. McComas | 1,738 | 2.17 | +1.08% | |
| Populist | Alfred Clark | 566 | 0.71 | N/A | |
| Labor | P. J. Weldon | 32 | 0.04 | N/A | |
| Total votes | 79,966 | 100.0 | |||
| Party | Candidate | Votes | % | ±% | |
|---|---|---|---|---|---|
| Republican | J. Frank Aldrich (incumbent) | 33,902 | 63.15 | +13.47% | |
| Democratic | Max Dembufsky | 12,854 | 23.94 | -23.46% | |
| Populist | Howard S. Taylor | 5,996 | 11.17 | +10.46% | |
| Prohibition | William H. Craig | 667 | 1.24 | -0.93% | |
| Independent American Citizen | Winfield S. McComas | 269 | 0.50 | N/A | |
| Total votes | 53,688 | 100.0 | |||
| Party | Candidate | Votes | % | ±% | |
|---|---|---|---|---|---|
| Republican | James Robert Mann | 51,582 | 67.64 | +4.49% | |
| Democratic | James H. Teller | 23,123 | 30.32 | +6.38% | |
| Populist | Benjamin J. Werthermer | 957 | 1.25 | -9.92% | |
| Unknown | Thomas R. Strobridge | 595 | 0.78 | N/A | |
| Total votes | 76,257 | 100.0 | |||
| Party | Candidate | Votes | % | ±% | |
|---|---|---|---|---|---|
| Republican | James Robert Mann (incumbent) | 37,500 | 63.23 | -4.41% | |
| Democratic | Rollin B. Organ | 20,424 | 34.43 | +4.11% | |
| Socialist Labor | Bernard Berlyn | 568 | 0.96 | N/A | |
| Prohibition | Theodore L. Neff | 414 | 0.70 | N/A | |
| Populist | James Hogan | 404 | 0.68 | -0.57% | |
| Total votes | 59,310 | 100.0 | |||
| Party | Candidate | Votes | % | ±% | |
|---|---|---|---|---|---|
| Republican | James Robert Mann (incumbent) | 52,775 | 63.02 | -0.21% | |
| Democratic | Leon Hornstein | 28,858 | 34.46 | +0.03% | |
| Social Democratic | William H. Collins | 1,208 | 1.44 | N/A | |
| Prohibition | William P. Ferguson | 899 | 1.07 | +0.37% | |
| Total votes | 83,740 | 100.0 | |||
1902–1910
| Party | Candidate | Votes | % | ±% | |
|---|---|---|---|---|---|
| Democratic | Martin Emerich | 16,591 | 51.29 | +16.83% | |
| Republican | Martin B. Madden | 15,339 | 47.42 | -15.60% | |
| Prohibition | Howard T. Wilcoxon | 415 | 1.28 | +0.21% | |
| Total votes | 32,345 | 100.0 | |||
| Party | Candidate | Votes | % | ±% | |
|---|---|---|---|---|---|
| Republican | Martin B. Madden | 24,097 | 58.00 | +10.58% | |
| Democratic | John S. Oehman | 9,166 | 22.06 | -29.23% | |
| Independent Republican | David S. Geer | 5,175 | 12.46 | N/A | |
| Socialist | Edward Loewenthal | 2,334 | 5.62 | N/A | |
| Prohibition | William H. Craig | 416 | 1.00 | -0.28% | |
| Populist | Charles Roberts | 234 | 0.56 | N/A | |
| Continental Party | J. P. Lynch | 127 | 0.31 | N/A | |
| Total votes | 41,549 | 100.0 | |||
| Party | Candidate | Votes | % | ±% | |
|---|---|---|---|---|---|
| Republican | Martin B. Madden (incumbent) | 17,015 | 59.32 | +1.32% | |
| Democratic | Martin Emerich | 10,015 | 34.92 | +12.86% | |
| Socialist | J. H. Greer | 1,402 | 4.89 | -0.73% | |
| Prohibition | Amasa Orelup | 251 | 0.88 | -0.12% | |
| Total votes | 28,683 | 100.0 | |||
| Party | Candidate | Votes | % | ±% | |
|---|---|---|---|---|---|
| Republican | Martin B. Madden (incumbent) | 23,370 | 60.92 | +1.60% | |
| Democratic | Matthew L. Mandable | 13,692 | 35.69 | +0.77% | |
| Socialist | Joseph N. Greer | 825 | 2.15 | -2.74% | |
| Independent | Henry W. Young | 469 | 1.22 | N/A | |
| Independent | Charles McCormick | 7 | 0.02 | N/A | |
| Total votes | 38,363 | 100.0 | |||
| Party | Candidate | Votes | % | ±% | |
|---|---|---|---|---|---|
| Republican | Martin B. Madden (incumbent) | 14,920 | 49.99 | -10.93% | |
| Democratic | Michael E. Maher | 13,466 | 45.12 | +9.43% | |
| Socialist | Joseph H. Greer | 1,165 | 3.90 | +1.75% | |
| Prohibition | H. E. Eckles | 293 | 0.98 | N/A | |
| Total votes | 29,844 | 100.0 | |||
1912–1920
| Party | Candidate | Votes | % | ±% | |
|---|---|---|---|---|---|
| Republican | Martin B. Madden (incumbent) | 13,608 | 52.16 | +2.17% | |
| Democratic | Andrew Donovan | 9,967 | 38.20 | -6.92% | |
| Socialist | William F. Barnard | 2,217 | 8.50 | +4.60% | |
| Prohibition | W. H. Rogers | 299 | 1.15 | +0.17% | |
| Total votes | 26,091 | 100.0 | |||
| Party | Candidate | Votes | % | ±% | |
|---|---|---|---|---|---|
| Republican | Martin B. Madden (incumbent) | 13,063 | 53.22 | +1.06% | |
| Democratic | James M. Quinlan | 9,060 | 36.91 | -1.29% | |
Progressive
|
Henry M. Ashton | 1,758 | 7.16 | N/A | |
| Socialist | Charles Leffler | 662 | 2.70 | -5.80% | |
| Total votes | 24,543 | 100.0 | |||
| Party | Candidate | Votes | % | ±% | |
|---|---|---|---|---|---|
| Republican | Martin B. Madden (incumbent) | 20,380 | 59.06 | +5.84% | |
| Democratic | William J. Hennessey | 13,380 | 38.77 | +1.86% | |
| Socialist | Robert H. Howe | 749 | 2.17 | -0.53% | |
| Total votes | 34,509 | 100.0 | |||
| Party | Candidate | Votes | % | ±% | |
|---|---|---|---|---|---|
| Republican | Martin B. Madden (incumbent) | 12,580 | 55.33 | -3.73% | |
| Democratic | George Mayer | 9,776 | 43.00 | +4.23% | |
| Socialist | G. J. Carlisle | 381 | 1.68 | -0.49% | |
| Total votes | 22,737 | 100.0 | |||
| Party | Candidate | Votes | % | ±% | |
|---|---|---|---|---|---|
| Republican | Martin B. Madden (incumbent) | 41,907 | 75.91 | +20.58% | |
| Democratic | James A. Gorman | 12,398 | 22.46 | -20.54% | |
| Socialist | Willis E. Davis | 899 | 1.63 | -0.05% | |
| Total votes | 55,204 | 100.0 | |||
1922–1930
| Party | Candidate | Votes | % | ±% | |
|---|---|---|---|---|---|
| Republican | Martin B. Madden (incumbent) | 23,895 | 59.09 | -16.82% | |
| Democratic | George Mayer | 15,999 | 39.56 | +17.10% | |
| Socialist | Charles Hallbeck | 427 | 1.06 | -0.57% | |
| Farmer–Labor | John H. Kennedy | 120 | 0.30 | N/A | |
| Total votes | 40,441 | 100.0 | |||
| Party | Candidate | Votes | % | ±% | |
|---|---|---|---|---|---|
| Republican | Martin B. Madden (incumbent) | 43,661 | 73.05 | +13.96% | |
| Democratic | James F. Doyle | 13,623 | 22.79 | -16.77% | |
| Independent | Samuel A. T. Watkins | 2,232 | 3.73 | N/A | |
| Socialist | Elmer Whitmore | 220 | 0.37 | -0.69% | |
| Independent | Gordon Owens | 32 | 0.05 | N/A | |
| Total votes | 59,768 | 100.0 | |||
| Party | Candidate | Votes | % | ±% | |
|---|---|---|---|---|---|
| Republican | Martin B. Madden (incumbent) | 26,559 | 68.20 | -4.85% | |
| Democratic | James F. Doyle | 12,283 | 31.54 | +8.75% | |
| Progressive | G. Victor Cools | 101 | 0.26 | N/A | |
| Total votes | 38,943 | 100.0 | |||
| Party | Candidate | Votes | % | ±% | |
|---|---|---|---|---|---|
| Republican | Oscar DePriest | 24,479 | 47.79 | -20.41% | |
| Democratic | Harry Baker | 20,664 | 40.34 | +8.80% | |
| Independent | William Harrison | 5,861 | 11.44 | N/A | |
| Independent | Benjamin W. Clayton | 123 | 0.24 | N/A | |
| Independent | Edward L. Doty | 100 | 0.20 | N/A | |
| Total votes | 51,227 | 100.0 | |||
| Party | Candidate | Votes | % | ±% | |
|---|---|---|---|---|---|
| Republican | Oscar DePriest (incumbent) | 23,719 | 58.36 | +10.57% | |
| Democratic | Harry Baker | 16,747 | 41.21 | +0.87% | |
| Independent | George W. Harts | 68 | 0.17 | N/A | |
| Independent | T. W. Chavers | 64 | 0.16 | N/A | |
| Independent | Edward Turner | 44 | 0.11 | N/A | |
| Total votes | 40,642 | 100.0 | |||
1932–1940
| Party | Candidate | Votes | % | ±% | |
|---|---|---|---|---|---|
| Republican | Oscar DePriest (incumbent) | 33,672 | 54.77 | -3.59% | |
| Democratic | Harry Baker | 26,959 | 43.85 | +2.64% | |
| Independent | Herbert Newton | 843 | 1.37 | N/A | |
| Total votes | 61,474 | 100.0 | |||
| Party | Candidate | Votes | % | ±% | |
|---|---|---|---|---|---|
| Democratic | Arthur W. Mitchell | 27,963 | 52.97 | +9.12% | |
| Republican | Oscar DePriest (incumbent) | 24,829 | 47.03 | -7.74% | |
| Total votes | 52,792 | 100.0 | |||
| Party | Candidate | Votes | % | ±% | |
|---|---|---|---|---|---|
| Democratic | Arthur W. Mitchell (incumbent) | 35,376 | 55.10 | +2.13% | |
| Republican | Oscar DePriest | 28,640 | 44.61 | -2.42% | |
| Independent | Harry Haywood | 192 | 0.30 | N/A | |
| Total votes | 64,208 | 100.0 | |||
| Party | Candidate | Votes | % | ±% | |
|---|---|---|---|---|---|
| Democratic | Arthur W. Mitchell (incumbent) | 30,207 | 53.37 | -1.73% | |
| Republican | William L. Dawson | 26,396 | 46.63 | +2.02% | |
| Total votes | 56,603 | 100.0 | |||
| Party | Candidate | Votes | % | ±% | |
|---|---|---|---|---|---|
| Democratic | Arthur W. Mitchell (incumbent) | 34,641 | 53.02 | -0.35% | |
| Republican | William E. King | 30,698 | 46.98 | +0.35% | |
| Total votes | 65,339 | 100.0 | |||
1942–1950
| Party | Candidate | Votes | % | ±% | |
|---|---|---|---|---|---|
| Democratic | William L. Dawson | 26,280 | 52.75 | -0.27% | |
| Republican | William E. King | 23,537 | 47.25 | +0.27% | |
| Total votes | 49,817 | 100.0 | |||
| Party | Candidate | Votes | % | ±% | |
|---|---|---|---|---|---|
| Democratic | William L. Dawson (incumbent) | 42,713 | 61.98 | +9.23% | |
| Republican | William E. King | 26,204 | 38.02 | -9.23% | |
| Total votes | 68,917 | 100.0 | |||
| Party | Candidate | Votes | % | ±% | |
|---|---|---|---|---|---|
| Democratic | William L. Dawson (incumbent) | 38,040 | 56.79 | -5.19% | |
| Republican | William E. King | 28,945 | 43.21 | +5.19% | |
| Total votes | 66,985 | 100.0 | |||
| Party | Candidate | Votes | % | ±% | |
|---|---|---|---|---|---|
| Democratic | William L. Dawson (incumbent) | 98,690 | 66.96 | +10.17% | |
| Republican | William E. King | 43,034 | 29.20 | -14.01% | |
Progressive
|
Earl B. Dickerson | 5,669 | 3.85 | N/A | |
| Total votes | 147,393 | 100.0 | |||
| Party | Candidate | Votes | % | ±% | |
|---|---|---|---|---|---|
| Democratic | William L. Dawson (incumbent) | 69,506 | 61.74 | -5.22% | |
| Republican | Archibald James Carey, Jr. | 41,944 | 37.26 | +8.06% | |
Progressive
|
Samuel J. Parks | 1,135 | 1.01 | -2.84% | |
| Total votes | 112,585 | 100.0 | |||
1952–1960
| Party | Candidate | Votes | % | ±% | |
|---|---|---|---|---|---|
| Democratic | William L. Dawson (incumbent) | 95,899 | 73.50 | +11.76% | |
| Republican | Edgar G. Brown | 34,571 | 26.50 | -10.76% | |
| Total votes | 130,470 | 100.0 | |||
| Party | Candidate | Votes | % | ±% | |
|---|---|---|---|---|---|
| Democratic | William L. Dawson (incumbent) | 71,472 | 75.28 | +1.78% | |
| Republican | Genoa S. Washington
|
23,470 | 24.72 | -1.78% | |
| Total votes | 94,942 | 100.0 | |||
| Party | Candidate | Votes | % | ±% | |
|---|---|---|---|---|---|
| Democratic | William L. Dawson (incumbent) | 66,704 | 64.42 | -10.86% | |
| Republican | George W. Lawrence | 36,847 | 35.58 | +10.86% | |
| Total votes | 103,551 | 100.0 | |||
| Party | Candidate | Votes | % | ±% | |
|---|---|---|---|---|---|
| Democratic | William L. Dawson (incumbent) | 60,778 | 72.22 | +7.80% | |
| Republican | Dr. Theodore R. M. Howard | 23,384 | 27.78 | -7.80% | |
| Total votes | 84,162 | 100.0 | |||
| Party | Candidate | Votes | % | ±% | |
|---|---|---|---|---|---|
| Democratic | William L. Dawson (incumbent) | 75,938 | 77.81 | +5.59% | |
| Republican | Genoa S. Washington
|
21,660 | 22.19 | -5.59% | |
| Total votes | 97,598 | 100.0 | |||
1962–1970
| Party | Candidate | Votes | % | ±% | |
|---|---|---|---|---|---|
| Democratic | William L. Dawson (incumbent) | 98,305 | 74.09 | -3.72% | |
| Republican | Benjamin C. Duster | 34,379 | 25.91 | +3.72% | |
| Total votes | 132,684 | 100.0 | |||
| Party | Candidate | Votes | % | ±% | |
|---|---|---|---|---|---|
| Democratic | William L. Dawson (incumbent) | 150,953 | 84.91 | +10.82% | |
| Republican | Wilbur N. Daniel | 26,823 | 15.09 | -10.82% | |
| Total votes | 177,776 | 100.0 | |||
| Party | Candidate | Votes | % | ±% | |
|---|---|---|---|---|---|
| Democratic | William L. Dawson (incumbent) | 91,119 | 72.58 | -12.33% | |
| Republican | David R. Reed | 34,421 | 27.42 | +12.33% | |
| Total votes | 125,540 | 100.0 | |||
| Party | Candidate | Votes | % | ±% | |
|---|---|---|---|---|---|
| Democratic | William L. Dawson (incumbent) | 119,207 | 84.56 | +11.98% | |
| Republican | Janet Roberts Jennings | 21,758 | 15.44 | -11.98% | |
| Total votes | 140,965 | 100.0 | |||
| Party | Candidate | Votes | % | ±% | |
|---|---|---|---|---|---|
| Democratic | Ralph H. Metcalfe | 93,272 | 90.96 | +6.40% | |
| Republican | Janet Roberts Jennings | 9,267 | 9.04 | -6.40% | |
| Total votes | 102,539 | 100.0 | |||
1972–1980
| Party | Candidate | Votes | % | ±% | |
|---|---|---|---|---|---|
| Democratic | Ralph H. Metcalfe (incumbent) | 136,755 | 91.39 | +0.43% | |
| Republican | Louis H. Coggs | 12,877 | 8.61 | -0.43% | |
| Write-in | 2 | 0.00 | N/A | ||
| Total votes | 149,634 | 100.0 | |||
| Party | Candidate | Votes | % | ±% | |
|---|---|---|---|---|---|
| Democratic | Ralph H. Metcalfe (incumbent) | 75,206 | 93.74 | +2.35% | |
| Republican | Oscar H. Haynes | 4,399 | 5.48 | -3.13% | |
| Socialist Workers | Willie Mae Reid | 620 | 0.77 | N/A | |
| Total votes | 80,225 | 100.0 | |||
2002
| Party | Candidate | Votes | % | |
|---|---|---|---|---|
| Democratic | Bobby Rush* | 149,068 | 81.17 | |
| Republican | Raymond G. Wardingley | 29,776 | 16.21 | |
| Libertarian | Dorothy Tsatsos | 4,812 | 2.62 | |
| Total votes | 183,656 | 100.00 | ||
| Turnout | {{{votes}}} | |||
| Democratic hold | ||||
2004
| Party | Candidate | Votes | % | |
|---|---|---|---|---|
| Democratic | Bobby Rush* | 211,115 | 84.82 | |
| Republican | Raymond G. Wardingley | 37,793 | 15.18 | |
| Total votes | 248,908 | 100.00 | ||
| Turnout | {{{votes}}} | |||
| Democratic hold | ||||
2006
| Party | Candidate | Votes | % | |
|---|---|---|---|---|
| Democratic | Bobby Rush* | 146,623 | 84.06 | |
| Republican | Jason E. Tabour | 27,804 | 15.94 | |
| Total votes | 174,427 | 100.00 | ||
| Turnout | {{{votes}}} | |||
| Democratic hold | ||||
2008
| Party | Candidate | Votes | % | |
|---|---|---|---|---|
| Democratic | Bobby Rush* | 233,036 | 85.87 | |
| Republican | Antoine Members | 38,361 | 14.13 | |
| Total votes | 271,397 | 100.00 | ||
| Turnout | {{{votes}}} | |||
| Democratic hold | ||||
2010
| Party | Candidate | Votes | % | |
|---|---|---|---|---|
| Democratic | Bobby Rush* | 148,170 | 80.36 | |
| Republican | Raymond G. Wardingley | 29,253 | 15.87 | |
Green
|
Jeff Adams | 6,963 | 3.78 | |
| Total votes | 184,386 | 100.00 | ||
| Turnout | {{{votes}}} | |||
| Democratic hold | ||||
2012
| Party | Candidate | Votes | % | |
|---|---|---|---|---|
| Democratic | Bobby Rush (incumbent) | 236,854 | 73.8 | |
| Republican | Donald Peloquin | 83,989 | 26.2 | |
Independent
|
John Hawkins (write-in) | 1 | 0.0 | |
| Total votes | 320,844 | 100.0 | ||
| Democratic hold | ||||
2014
| Party | Candidate | Votes | % | |
|---|---|---|---|---|
| Democratic | Bobby Rush (incumbent) | 162,268 | 73.1 | |
| Republican | Jimmy Lee Tillman | 59,749 | 26.9 | |
| Total votes | 222,017 | 100.0 | ||
| Democratic hold | ||||
2016
| Party | Candidate | Votes | % | |
|---|---|---|---|---|
| Democratic | Bobby Rush (incumbent) | 234,037 | 74.1 | |
| Republican | August Deuser | 81,817 | 25.9 | |
Independent
|
Tabitha Carson (write-in) | 8 | 0.0 | |
| Total votes | 315,862 | 100.0 | ||
| Democratic hold | ||||
2018
| Party | Candidate | Votes | % | |
|---|---|---|---|---|
| Democratic | Bobby Rush (incumbent) | 189,560 | 73.5 | |
| Republican | Jimmy Lee Tillman, II | 50,960 | 19.8 | |
Independent
|
Thomas Rudbeck | 17,365 | 6.7 | |
| Total votes | 257,885 | 100.0 | ||
| Democratic hold | ||||
2020
| Party | Candidate | Votes | % | ±% | |
|---|---|---|---|---|---|
| Democratic | Bobby Rush (incumbent) | 239,943 | 73.80 | +0.29% | |
| Republican | Philanise White | 85,027 | 26.15 | +6.39% | |
| Write-in | 153 | 0.05 | N/A | ||
| Total votes | 325,123 | 100.0 | |||
| Democratic hold | |||||
2022
| Party | Candidate | Votes | % | |
|---|---|---|---|---|
| Democratic | Jonathan Jackson | 159,142 | 67.03 | |
| Republican | Eric Carlson | 78,258 | 32.96 | |
| Write-in | 25 | 0.01 | ||
| Total votes | 237,425 | 100.0 | ||
| Democratic hold | ||||
See also
References
- ^ "My Congressional District: Congressional District 1 (118th Congress), Illinois". United States Census Bureau.
- ^ "2022 Cook PVI: District Map and List". Cook Political Report. Retrieved January 10, 2023.
- ^ "Jonathan Jackson keeps 1st congressional seat in Democratic hands following US Rep. Bobby Rush's retirement". Chicago Tribune. November 9, 2022. Retrieved November 21, 2022.
- ^ ISBN 0-8371-9828-3.
- ^ ISBN 0-313-22045-X.
- ^ a b Parsons, et al. (1986), pp. 53–54.
- ^ a b c d e
ISBN 978-0-226-10544-4. Copyright National Journal.
- ^ ISBN 0-87187-264-1.
- ^ Congressional District Data Book: Districts of the 87th Congress. Washington, D.C.: U.S. Bureau of the Census. 1961. p. 16.
- ISBN 0-87187-722-8.
- ISBN 1-56802-849-0.
- ^ See U.S. Census Bureau map showing distribution of district's white population.
- ^ Congressional Districts in the 2000s: A Portrait of America, p. 298.
- ^ Illinois Congressional District 1, Illinois Board of Elections
- ^ a b c d e Vote totals from 1852 to 1868 are based on cumulative county totals as listed in Illinois: Historical and Statistical (1892), John Moses, Chicago: Fergus Printing Co., pp. 1208–1209.
- ^ a b Congressional District Data Book: Districts of the 87th Congress, p. 17.
- ^ "Statistics of the Presidential and Congressional Election of November 8, 1960" (PDF). Clerk of the House of Representatives. pp. 10–12.
- ^ "Statistics of the Presidential and Congressional Election of November 3, 1964" (PDF). Clerk of the House of Representatives. pp. 12 & 13.
- ISBN 0-87645-053-2.
- ^ Barone, et al. (1973), p. 263.
- ISBN 0-87690-255-7.
- ^ Barone, et al. (1981), p. 295.
- ISBN 0-89234-032-0.
- ISBN 0-89234-043-6.
- ISBN 0-89234-057-6.
- ISBN 0-89234-081-9.
- ISBN 0-89234-099-1.
- ^ a b Barone, et al. (2005), p. 561.
- ISBN 1-56802-981-0.
- ISBN 0-87645-077-X.
- ISBN 0-940702-00-2.
- ISBN 0-89234-111-4.
- ^ ISBN 1-56802-655-2.
- ^ "Votes Against Party by Bobby Rush". The Washington Post. Archived from the original on June 29, 2007. Retrieved June 30, 2007.
- ^ Barone, et al. (2005), p. 563.
- ISBN 1-56802-970-5.
- ^ "Bobby Rush on the Issues". Retrieved June 30, 2007.
- ^ "Rep. Bobby Rush". CPAC Ratings. 2024. Retrieved April 22, 2024.
- ^ Parsons, et al. (1986), pp. 102–103.
- ^ Guide to U.S. Elections, p. 940.
- ^ Parsons, et al. (1986), pp. 159–160.
- ISBN 0-313-26482-1.
- ^ Parsons, et al. (1990), pp. 182–186.
- ^ Parsons, et al. (1990), pp. 187–191.
- ^ Parsons, et al. (1990), pp. 326–330.
- ^ Barrett, Edward A. (ed.). Blue Book of the State of Illinois, 1947–1948. Springfield, IL: State of Illinois. p. 110.
- ^ Barrett, pp. 113–114.
- ^ Congressional District Atlas of the United States. Washington, D.C.: U.S. Bureau of the Census. 1960. pp. 18–20.
- ^ Congressional District Data Book: Districts of the 88th Congress. Washington, D.C.: U.S. Bureau of the Census. 1963. pp. 125–127.
- ^ Congressional District Data Book, Illinois supplement. Washington, D.C.: U.S. Bureau of the Census. 1966. pp. 2–4.
- ^ Congressional District Data Book: 93rd Congress. Washington, D.C.: U.S. Bureau of the Census. 1973. pp. 145, 147–148.
- ^ Congressional Districts in the 1980s, p. 163.
- ISBN 0-16-041689-2.
- . Retrieved April 7, 2022.
- . Retrieved April 7, 2022.
- . Retrieved April 7, 2022.
- . Retrieved April 7, 2022.
- . Retrieved April 7, 2022.
- . Retrieved April 7, 2022.
- . Retrieved April 7, 2022.
- . Retrieved April 7, 2022.
- . Retrieved April 7, 2022.
- ^ "IL District 1". Our Campaigns. Retrieved April 7, 2022.
- ^ "IL District 1". Our Campaigns. Retrieved April 7, 2022.
- ^ "IL District 1". Our Campaigns. Retrieved April 7, 2022.
- ^ "IL District 1". Our Campaigns. Retrieved April 7, 2022.
- ^ "IL District 1". Our Campaigns. Retrieved April 7, 2022.
- ^ "IL District 1". Our Campaigns. Retrieved April 7, 2022.
- ^ "IL District 1". Our Campaigns. Retrieved April 7, 2022.
- ^ "IL District 1". Our Campaigns. Retrieved April 14, 2022.
- ^ "IL District 1". Our Campaigns. Retrieved April 14, 2022.
- ^ "IL District 1". Our Campaigns. Retrieved April 14, 2022.
- ^ "IL District 1". Our Campaigns. Retrieved April 14, 2022.
- ^ "IL District 1". Our Campaigns. Retrieved April 15, 2022.
- ^ "IL District 1". Our Campaigns. Retrieved April 15, 2022.
- ^ "IL District 1". Our Campaigns. Retrieved April 15, 2022.
- ^ "IL District 1". Our Campaigns. Retrieved April 15, 2022.
- ^ "IL District 1". Our Campaigns. Retrieved April 19, 2022.
- ^ "IL District 1". Our Campaigns. Retrieved April 19, 2022.
- ^ "IL District 1". Our Campaigns. Retrieved April 19, 2022.
- ^ "IL District 1". Our Campaigns. Retrieved April 19, 2022.
- ^ "IL District 1". Our Campaigns. Retrieved April 19, 2022.
- ^ a b c d e f g h i j k l m n o p q r s t u v w x y z aa ab ac ad ae af ag ah ai aj ak al am "Downloadable Vote Totals". Illinois State Board of Elections. Illinois State Board of Elections. Retrieved April 19, 2022.
- ^ "IL District 1". Our Campaigns. Retrieved April 19, 2022.
- ^ "IL District 1". Our Campaigns. Retrieved April 19, 2022.
- ^ "IL District 1". Our Campaigns. Retrieved April 19, 2022.
- ^ "IL District 1". Our Campaigns. Retrieved April 19, 2022.
- ^ "IL District 1". Our Campaigns. Retrieved April 19, 2022.
- ^ "IL District 1". Our Campaigns. Retrieved April 19, 2022.
- ^ "IL District 1". Our Campaigns. Retrieved April 19, 2022.
- ^ "IL District 1". Our Campaigns. Retrieved April 19, 2022.
- ^ "Illinois blue book, 1905–1906". Illinois Digital Archives. Illinois Secretary of State's Office. 1905–1906. Retrieved October 12, 2022.
- ^ "Illinois blue book, 1909–1910". Illinois Digital Archives. Illinois Secretary of State's Office. 1909–1910. p. 397. Retrieved October 12, 2022.
- ^ "2012 General Election Official Vote Totals" (PDF). Illinois State Board of Elections. Archived from the original (PDF) on November 19, 2013. Retrieved March 26, 2012.
- ^ "Illinois General Election 2014". Illinois State Board of Elections. November 4, 2014. Retrieved December 18, 2014.
- ^ "Illinois General Election 2016". Illinois State Board of Elections. November 8, 2016. Archived from the original on March 27, 2019. Retrieved December 13, 2016.
- ^ "2018 General Election Official Vote Totals Book".
- ^ "Election Results 2020 GENERAL ELECTION". Illinois State Board of Elections. December 4, 2020. Retrieved December 4, 2020.
- ^ "Illinois 2020 Election Results". Chicago Sun-Times. November 20, 2020. Retrieved November 20, 2020.
External links
- Washington Post page on the 1st District of Illinois
- "Statistical Abstract of the United States: 2003" (PDF). (163 KiB) – Congressional District Profiles, U.S. Census Bureau
- "U.S. Census Bureau – 1st District map" (PDF). (1.47 MiB)
- U.S. Census Bureau – 1st District Fact Sheet