1992 United States presidential election
| |||||||||||||||||||||||||||||||||||||
538 members of the Electoral College 270 electoral votes needed to win | |||||||||||||||||||||||||||||||||||||
|---|---|---|---|---|---|---|---|---|---|---|---|---|---|---|---|---|---|---|---|---|---|---|---|---|---|---|---|---|---|---|---|---|---|---|---|---|---|
| Turnout | 58.1%[1] | ||||||||||||||||||||||||||||||||||||
| |||||||||||||||||||||||||||||||||||||
 Presidential election results map. Blue denotes states won by Clinton/Gore and red denotes those won by Bush/Quayle. Numbers indicate electoral votes cast by each state and the District of Columbia. | |||||||||||||||||||||||||||||||||||||
| |||||||||||||||||||||||||||||||||||||


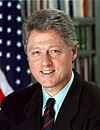
The 1992 United States presidential election was the 52nd quadrennial presidential election, held on Tuesday, November 3, 1992. Democratic Governor Bill Clinton of Arkansas defeated incumbent Republican President George H. W. Bush and independent businessman Ross Perot of Texas. The election marked the end of a period of Republican dominance in American presidential politics that began in 1968 (with 1976 being the sole exception), and also marked the end of 12 years of Republican rule of the White House, as well as the end of the Greatest Generation's 32-year American rule and the beginning of the baby boomers' 28-year dominance until 2020. It was the last time the incumbent president failed to win a second term until Donald Trump in 2020.
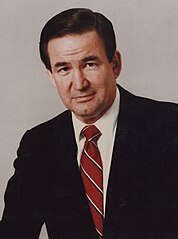
Bush had alienated many of the conservatives in his party by breaking his 1988 campaign pledge against raising taxes, but he fended off a primary challenge from paleoconservative commentator Pat Buchanan. Bush's popularity following his success in the Gulf War dissuaded high-profile Democratic candidates like Mario Cuomo from entering the 1992 Democratic primaries. Clinton, a leader of the centrist Democratic Leadership Council, established himself as the front-runner for the Democratic nomination by sweeping the Super Tuesday primaries. He defeated former Governor of California Jerry Brown, former Massachusetts Senator Paul Tsongas, and other candidates to win his party's nomination, and chose Tennessee Senator Al Gore as his running mate. Billionaire Ross Perot launched an independent campaign, emphasizing his opposition to the North American Free Trade Agreement and his plan to reduce the national debt.
The economy had recovered from a recession in the spring of 1991, followed by 19 consecutive months of economic growth, but perceptions of the economy's slow growth harmed Bush, for he had inherited a substantial economic boom from his predecessor Ronald Reagan. Bush's greatest strength, foreign policy, was regarded as much less important following the dissolution of the Soviet Union and the end of the Cold War, as well as the relatively peaceful climate in the Middle East after the Gulf War. Perot led in several polls taken in June 1992, but severely damaged his candidacy by temporarily dropping out of the race in July. The Bush campaign criticized Clinton's character and emphasized Bush's foreign policy successes, while Clinton focused on the economy.
Clinton won a plurality in the popular vote and a majority of the
Perot won 18.9% of the popular vote, the
| ||
|---|---|---|
|
40th & 42nd Governor of Arkansas
42nd President of the United States
Policies
Appointments
First term
Second term
Presidential campaigns Controversies
Post-presidency
|
||
| ||
|---|---|---|
|
Vice President of the United States
Presidential campaigns
Vice presidential campaigns
|
||
Democratic Party nomination
 | |||||||||||||||||||||||||||||
| Bill Clinton | Al Gore | ||||||||||||||||||||||||||||
|---|---|---|---|---|---|---|---|---|---|---|---|---|---|---|---|---|---|---|---|---|---|---|---|---|---|---|---|---|---|
| for President | for Vice President | ||||||||||||||||||||||||||||
 |
 | ||||||||||||||||||||||||||||
Governor of Arkansas (1979–1981, 1983–1992) |
U.S. Senator from Tennessee (1985–1993) | ||||||||||||||||||||||||||||
| Campaign | |||||||||||||||||||||||||||||
 | |||||||||||||||||||||||||||||
.jpg)


Overview
Following the successful performance by U.S. and coalition forces in the Persian Gulf War, President George H. W. Bush's approval ratings were 89%. His re-election was considered very likely; several high-profile candidates, such as Mario Cuomo and Jesse Jackson refused to seek the Democratic nomination. Senator Al Gore refused to seek the nomination due to the fact his son had been struck by a car and was undergoing surgery and physical therapy. However, Tom Harkin, Paul Tsongas, Jerry Brown, Larry Agran, Bob Kerrey, Douglas Wilder and Bill Clinton chose to run as candidates.
U.S. Senator Tom Harkin (Iowa) ran as a populist liberal with labor union support. Former U.S. Senator Paul Tsongas (Mass.) highlighted his political independence and fiscal conservatism. Former California Governor Jerry Brown, who had run for the Democratic nomination in 1976 and 1980, declared a significant reform agenda, including Congressional term limits, campaign finance reform, and the adoption of a flat income tax. Nebraska Senator Bob Kerrey was an attractive candidate based on his business and military background, but made several gaffes on the campaign trail. Arkansas Governor Bill Clinton positioned himself as a centrist, or New Democrat. He was relatively unknown nationally before the primary season. That quickly changed however, when Gennifer Flowers alleged an extramarital affair. Clinton denied the story, appearing on 60 Minutes with his wife, Hillary Clinton; in 1998, he admitted the affair.[2]
The primary began with Harkin winning his native Iowa as expected. Tsongas won the
The convention met in New York City, and the official tally was:
- Bill J. Clinton3,372
- Jerry Brown 596
- Paul Tsongas 289
- Robert P. Casey10
- Pat Schroeder 5
- Larry Agran 3
- Al Gore 1
Clinton chose U.S. Senator Al Gore (D-Tennessee) to be his running mate on July 9, 1992. Choosing fellow Southerner Gore went against the popular strategy of balancing a Southern candidate with a Northern partner. Gore served to balance the ticket in other ways, as he was perceived as strong on family values and environmental issues, while Clinton was not.[4] Also, Gore's similarities to Clinton allowed him to push some of his key campaign themes, such as centrism and generational change.[5]
Republican Party nomination
| ||
|---|---|---|
|
Pre-vice presidency
43rd Vice President of the United States 41st President of the United States
Policies
Appointments
Tenure
Presidential campaigns Vice presidential campaigns Post-presidency
 |
||
.jpg)
 | |||||||||||||||||||||||||||||
| George H. W. Bush | Dan Quayle | ||||||||||||||||||||||||||||
|---|---|---|---|---|---|---|---|---|---|---|---|---|---|---|---|---|---|---|---|---|---|---|---|---|---|---|---|---|---|
| for President | for Vice President | ||||||||||||||||||||||||||||
.jpg) |
 | ||||||||||||||||||||||||||||
| 41st President of the United States (1989–1993) |
44th Vice President of the United States (1989–1993) | ||||||||||||||||||||||||||||
| Campaign | |||||||||||||||||||||||||||||
-
-
 President
George H. W. Bush -
-


.jpg)
.jpg)

Paleoconservative journalist Pat Buchanan was the primary opponent of President Bush; Ron Paul, the Libertarian Party's presidential nominee in 1988, had planned to run against the President, but dropped out shortly after Buchanan's entry in December. Buchanan's best showing was in the New Hampshire primary on February 18, 1992—where Bush won by a 53–38% margin.[6] President Bush won 73% of all primary votes, with 9,199,463 votes. Buchanan won 2,899,488 votes; unpledged delegates won 287,383 votes, and David Duke, Grand Wizard of the Ku Klux Klan, won 119,115 votes. Just over 100,000 votes were cast for all other candidates, half of which were write-in votes for H. Ross Perot.[7] Former Minnesota Governor Harold Stassen, who had run for President 9 times since 1944, also mounted his final campaign.
President George H. W. Bush and Vice President Dan Quayle easily won renomination by the Republican Party. However, the success of the opposition forced the moderate Bush to move further to the right than in the previous election, and to incorporate many socially conservative planks in the party platform. Bush allowed Buchanan to give a prime time address at the Republican National Convention in Houston, Texas, and his "Culture War" speech alienated Liberal Republicans.
With intense pressure on the Buchanan delegates to relent, the tally for president went as follows:
- George H. W. Bush 2166
- Pat Buchanan 18
- former ambassador Alan Keyes 1
Vice President Dan Quayle was renominated by voice vote.
Ross Perot candidacy
| 1992 independent ticket | |
| Ross Perot | James Stockdale |
|---|---|
| for President | for Vice President |

|
 |
| President and CEO of Perot Systems (1988–2009) |
President of the Naval War College (1977–1979) |
| Campaign | |


The public's concern about the federal budget deficit and fears of professional politicians allowed the independent candidacy of billionaire Texan Ross Perot to explode on the scene in dramatic fashion—at one point Perot was leading the major party candidates in the polls.[8] Perot crusaded against the North American Free Trade Agreement (NAFTA), and internal and external national debt, tapping into voters' potential fear of the deficit. His volunteers succeeded in collecting enough signatures to get his name on the ballot in all 50 states. In June, Perot led the national public opinion polls with support from 39% of the voters (versus 31% for Bush and 25% for Clinton).[8] Perot severely damaged his credibility by dropping out of the presidential contest in July and remaining out of the race for several weeks before re-entering. He compounded this damage by eventually claiming, without evidence, that his withdrawal was due to Republican operatives attempting to disrupt his daughter's wedding.[9]
Perot and retired Vice Admiral James Stockdale drew 19,743,821 votes (19% of the popular vote).
Minor parties and independents
| Minor party candidates, 1992 | |||||||||||||||||||||||||||||
| Libertarian | New Alliance | Natural Law | Populist | U.S. Taxpayers' | National Economic Recovery | ||||||||||||||||||||||||
|---|---|---|---|---|---|---|---|---|---|---|---|---|---|---|---|---|---|---|---|---|---|---|---|---|---|---|---|---|---|
| Andre Marrou | Lenora Fulani | John Hagelin | Bo Gritz | Howard Phillips | Lyndon LaRouche | ||||||||||||||||||||||||
 |
 |
 |
 |
 | |||||||||||||||||||||||||
| Alaska State Representative (1985–1987) |
Psychologist and political activist |
Scientist and researcher |
Conservative political activist |
Conservative political activist |
Political activist | ||||||||||||||||||||||||
Libertarian Party nomination

Libertarian candidates:
- Andre Marrou, former Alaska State Representative and 1988 vice presidential nominee
- Richard B. Boddie, political science professor from California
The 6th Libertarian Party National Convention was held in Chicago, Illinois. There, the Libertarian Party nominated Andre Marrou, former Alaska State Representative and the Party's 1988 vice-presidential candidate, for President. Nancy Lord was his running mate.
Marrou and Lord drew 291,627 votes (0.28% of the popular vote).
New Alliance Party nomination

New Alliance candidate:
- Lenora Fulani, Psychotherapist and political activist from New Jersey, and the 1988 Presidential nominee
Lenora Fulani, who was the 1988 presidential nominee of the New Alliance Party, received a second consecutive nomination from the Party in 1992. Unlike in 1988, Fulani failed to gain ballot access in every state, deciding to concentrate some of that campaign funding towards exposure of her candidacy and the Party to the national public.
Fulani also sought the endorsement of the Peace and Freedom Party of California, but despite winning a majority in that party's primary, she would lose the nomination to Ronald Daniels, the former Director the National Rainbow Coalition. Rather than pursuing a ballot space of her own, Fulani would endorse Daniels's candidacy in California.
Fulani and her running mate Maria Elizabeth Muñoz received 73,622 votes (0.1% of the popular vote).
Natural Law Party nomination

The newly formed Natural Law Party nominated scientist and researcher John Hagelin for President and Mike Tompkins for Vice President. The Natural Law Party had been founded in 1992 by Hagelin and 12 others who felt that governmental problems could be solved more effectively by following "Natural Laws". The party platform included preventive health care, sustainable agriculture and renewable energy technologies. During this and future campaigns, Hagelin favored abortion rights without public financing, campaign finance law reform, improved gun control, a flat tax, the eradication of PACs, a ban on soft money contributions, and school vouchers.
The party's first presidential ticket appeared on the ballot in 28 states and drew 37,137 votes (<0.1% of the popular vote).
U.S. Taxpayers' Party nomination

U.S. Taxpayers' candidates:
- Howard Phillips, conservative political activist from Virginia
- Pat Buchanan, conservative columnist from Virginia (declined interest)
- Gordon J. Humphrey, former Senator from New Hampshire (declined interest)
The
No one, however, announced any intention to seek the Taxpayers Party nomination; Buchanan himself in the end endorsed President Bush at the Republican National Convention in Houston. Phillips had been unofficially nominated earlier in the year so as to allow the Party to be able to seek ballot access properly. While initially a temporary post, it was made permanent at the party's national convention, which was held in New Orleans on September 4 and 5. At the convention, which was attended by delegates from thirty-two states and Washington, D.C., Phillips received 264 votes on the first ballot, while Albion Knight was approved as his running mate by acclamation.[10]: 412
Earlier that year, in the June 2 California primary, Phillips had received 15,456 votes in the American Independent Party primary. On August 30, the American Independent Party voted to affiliate with the U.S. Taxpayers Party, an affiliation which continued until 2008.[10]: 378
Phillips and Knight drew 43,369 votes (<0.1% of the popular vote).
Populist Party nomination

Populist candidate:
- Special Forces officer and Vietnam veteran
Former
During August 1992, Gritz attracted national attention as mediator during the government standoff with Randy Weaver at Ruby Ridge, Idaho.
He received 106,152 votes nationwide (0.1% of the popular vote). In two states he had a respectable showing for a minor third party candidate: Utah, where he received 3.8% of the vote and Idaho, where he received 2.1% of the vote. In some counties, his support topped 10%, and in Franklin County, Idaho, was only a few votes away from pushing Bill Clinton into fourth place in the county.
Lyndon LaRouche's candidacy

While officially running for the Democratic Presidential nomination, Lyndon LaRouche also decided to run as an Independent in the general election, standing as the National Economic Recovery candidate.[11] LaRouche was in jail at the time, having been convicted of conspiracy to commit mail fraud in December 1988; it was only the second time in history that the presidency was sought from a prison cell (after Socialist Party candidate Eugene V. Debs, while imprisoned for his opposition to U.S. involvement in World War I, ran in 1920). His running-mate was James Bevel, a civil rights activist who had represented the LaRouche movement in its pursuit of the Franklin child prostitution ring allegations.
In addition to the displayed states, LaRouche had nearly made the ballot in the states of New York and Mississippi. In the case of New York, while his petition was valid and had enough signatures, none of his electors filed declarations of candidacy; in the cases of Mississippi a
Socialist Workers' Party nomination

Socialist Workers candidate:
- James Warren, journalist and steel worker from Illinois, and the 1988 Presidential nominee
James Warren, who was the 1988 presidential nominee of the Socialist Workers Party, received a second consecutive nomination from the Party on the first of November 1991. Warren had two running mates that varied from state to state; Estelle DeBates and Willie Mae Reid, the latter also a resident of Illinois.
Warren received 22,882 votes (<0.1% of the popular vote).
Ron Daniels candidacy

- Ronald Daniels, former director of the National Rainbow Coalition
Ronald Daniels was the former executive director for the Center for Constitutional Rights, the former director of the National Rainbow Coalition, and the worked on both of Jesse Jackson's campaigns for the Democratic presidential nomination. Asiba Tupahache, a Native American activist from New York was his running-mate.
Though running an Independent campaign under the label "Campaign for a Better Tomorrow", Daniels was endorsed by a number of third parties across the states, most notably the Peace and Freedom Party of California; though he had lost that party's presidential primary to Lenora Fulani, the nominee of the New Alliance Party, the delegates at its convention voted in favor of his candidacy 110–91, the only time it has ever nominated someone other than the winner of the primary.
Daniels and Tupachache drew 27,396 votes (<0.1% of the popular vote).
Other nominations
The 1992 campaign also marked the entry of
The
John Viamouyiannis Canidacy
Ballot Access: Michigan, New Jersey (33 Electoral)
John Yiamouyiannis, a major opponent of water fluoridation, ran as an Independent under the label "Take Back America". Allen C. McCone was his running-mate. Yiamouyiannis and McCone drew 2,199 votes. [citation needed]
Socialist Party Nomination
Ballot Access: Arkansas, Iowa, Louisiana, Tennessee (33 Electoral)
The Socialist Party nominated J. Quinn Brisben for President and Barbara Garson for Vice President. Brisben and Garson drew 2,909 votes.
Grassroots Party Nomination
Ballot Access: DC, Tennessee, Utah, Wisconsin (30 Electoral)
The Grassroots Party nominated Jack Herer, a noted cannabis activist for President and Derrick Grimmer for Vice President. Herer and Grimmer drew 3,875 votes.
Prohibition Party Nomination
Ballot Access: Iowa, Minnesota, Wisconsin (28 Electoral)
The Prohibition Party nominated Earl Dodge, the party's chairman for President and George Ormsby for Vice President. Dodge and Ormsby drew 935 votes.
Drew Bradford Canidacy
Ballot Access: Arkansas, New Mexico, Tennessee (22 Electoral)
Drew Bradford was an Independent candidate for the Presidency; he did not have a running-mate. Bradford drew 4,749 votes. [citation needed]
Delbert Ehlers Canidacy
Ballot Access: Wisconsin (11 Electoral)
Delbert Ehlers was an Independent candidate for the Presidency. His running-mate was Rick Wendt. Ehlers and Wendt drew 1,149 votes. [citation needed]
General election
Campaign
After Bill Clinton secured the Democratic Party's nomination in the spring of 1992, polls showed Ross Perot leading the race, followed by President Bush and Clinton in third place after a grueling nomination process. Two-way trial heats between Bush and Clinton in early 1992 showed Bush in the lead.[13][14][15][16] As the economy continued to sour and the President's approval rating continued to slide, the Democrats began to rally around their nominee. On July 9, 1992, Clinton chose Tennessee senator and former 1988 presidential candidate Al Gore to be his running mate.[17] As Governor Clinton's nomination acceptance speech approached, Ross Perot dropped out of the race, convinced that staying in the race with a "revitalized Democratic Party" would cause the race to be decided by the United States House of Representatives.[18] Clinton gave his acceptance speech on July 16, 1992, promising to bring a "new covenant" to America, and to work to heal the gap that had developed between the rich and the poor during the Reagan/Bush years.[19] The Clinton campaign received the biggest convention "bounce" in history[20] which brought him from 25 percent in the spring, behind Bush and Perot, to 55 percent versus Bush's 31 percent.
After the convention, Clinton and Gore began a bus tour around the United States, while the Bush/Quayle campaign began to criticize Clinton's character, highlighting accusations of infidelity and draft dodging. The Bush campaign emphasized its foreign policy successes such as
Presidential debates
The Commission on Presidential Debates organised four presidential debates[27]
| No. | Date | Host | Location | Panelists | Moderator | Participants | Viewership
(Millions) |
|---|---|---|---|---|---|---|---|
| P1 | Sunday, October 11, 1992 | Washington University in St. Louis | St. Louis, Missouri | Sander Vanocur Ann Compton John Mashek |
Jim Lehrer | President George H. W. Bush Governor Bill Clinton Mr. Ross Perot |
62.4[27] |
| VP | Tuesday, October 13, 1992 | Georgia Institute of Technology
|
Atlanta, Georgia | n/a | Hal Bruno | Vice President Dan Quayle Senator Al Gore Admiral James Stockdale |
51.2[27] |
| P2 | Thursday, October 15, 1992 | University of Richmond | Richmond, Virginia | n/a | Carole Simpson | President George H. W. Bush Governor Bill Clinton Mr. Ross Perot |
69.9[27] |
| P3 | Monday, October 19, 1992 | Michigan State University | East Lansing, Michigan | Gene Gibbons Helen Thomas Susan Rook |
Jim Lehrer | President George H. W. Bush Governor Bill Clinton Mr. Ross Perot |
66.9[27] |
Character issues
Many character issues were raised during the campaign, including allegations that Clinton had
Allegations were also made that Bill Clinton had engaged in a long-term extramarital affair with Gennifer Flowers.[28] Clinton denied ever having an affair with Flowers.[29]


Results
On November 3, Bill Clinton won the election to serve as the 42nd president of the United States by a wide margin in the Electoral College, receiving 43% of the popular vote against Bush's 37.4% and Perot's 18.9%. It was the first time since 1968 that a candidate won the White House with under 50% of the popular vote. Only Washington, D.C., and Clinton's home state of Arkansas gave the majority of their votes to a single candidate in the entire country; the rest were won by pluralities of the vote. Clinton was the first Democrat since 1964 to win a majority of states.
Even though Clinton received roughly 3,100,815 more votes than Democratic nominee Michael Dukakis had four years earlier, the Democrats recorded a 2.7 percentage point decrease in their share of the popular vote compared to 1988 due to the higher turnout. His 43% share of the popular vote was the second-lowest for any winning candidate in the 20th century after Woodrow Wilson in 1912 (41.8%). President Bush's 37.4% was the lowest percentage total for a sitting president seeking re-election since William Howard Taft, also in 1912 (23.2%).[30] 1992 was, as the 1912 election was, a three-way race (that time between Taft, Wilson, and Theodore Roosevelt). It was also the lowest percentage for a major-party candidate since Alf Landon received 36.5% of the vote in 1936. Bush had a lower percentage of the popular vote than even Herbert Hoover, who was defeated in 1932 (39.7%). However, none of these races included a major third party candidate.
Independent candidate
Perot's 18.9% of the popular vote made him the most successful non-major party presidential candidate in terms of popular vote since
The election was the most recent in which Montana voted for the Democratic candidate, the last time Florida backed the losing candidate until 2020 and the last time Georgia voted for the Democratic candidate also until 2020, and the last time that Colorado voted Democratic until 2008. This was also the first time since Texas' admission to the Union in 1845 that a Democrat won the White House without winning the state, and the second time a Democrat won the White House without North Carolina (the first was 1844), and the second time since Florida's admission (also in 1845) that a Democrat won without winning the state (John F. Kennedy in 1960 was the first).
Clinton was also the only Democrat at that point to win every electoral vote in the Northeast except for
The 168 electoral votes received by Bush, added to the 426 electoral votes he received in
's 1,876 total electoral votes.Analysis
Several factors made the results possible. First, the campaign came on the heels of an economic slowdown. Exit polling showed that 75% thought the economy was in fairly or very bad shape while 63% thought their personal finances were better or the same as four years ago.[32] The decision by Bush to accept a tax increase adversely affected his re-election bid. Pressured by rising budget deficits, Bush agreed to a budget compromise with Congress which raised taxes and reduced the federal budget deficit. Clinton was able to condemn the tax increase effectively on both its own merits and as a reflection of Bush's dishonesty. Effective Democratic TV ads were aired showing a clip of Bush's 1988 acceptance speech in which he promised "Read my lips … No new taxes." Most importantly, Bush's coalition was in disarray, for both the aforementioned reasons and for unrelated reasons. The end of the Cold War allowed old rivalries among conservatives to re-emerge and meant that other voters focused more on domestic policy, to the detriment of Bush, a social and fiscal moderate. The consequence of such a perception depressed conservative turnout.[33]
The election was compared to the 1945 United Kingdom general election, in which Winston Churchill, while a respected conservative wartime leader (like Bush) was not regarded as a good peacetime leader, and thus was voted out once the conflict was over.[34]
Unlike Bush, Clinton was able to unite his fractious and ideologically diverse party behind his candidacy, even when its different wings conflicted. To garner the support of moderates and conservative Democrats, he attacked Sister Souljah, an obscure rap musician whose lyrics Clinton condemned. Furthermore, Clinton made clear his support of the death penalty and would later champion making school uniforms in public schools a requirement.[35] Clinton could also point to his centrist record as governor of Arkansas. More liberal Democrats were impressed by Clinton's record on abortion and affirmative action. His strong connections to African Americans also played a key role. In addition, he organized significant numbers of young voters and became a symbol of the rise of the baby boomer generation to political power.[36] Supporters remained energized and confident, even in times of scandal or missteps.
The effect of Ross Perot's candidacy has been a contentious point of debate for many years. In the ensuing months after the election, various Republicans asserted that Perot had acted as a spoiler, enough to the detriment of Bush to lose him the election. While many disaffected conservatives may have voted for Ross Perot to protest Bush's tax increase, further examination of the Perot vote in the Election Night exit polls not only showed that Perot siphoned votes nearly equally among Bush and Clinton,[37][38][39][40] but roughly two-thirds of those voters who cited Bush's broken "No New Taxes" pledge as "very important" (25%) voted for Bill Clinton.[41] The voting numbers reveal that to win the electoral vote Bush would have had to win 10 of the 11 states Clinton won by less than five percentage points. For Bush to earn a majority of the popular vote, he would have needed 12.2% of Perot's 18.9% of the vote, 65% of Perot's support base.[42] State exit polls suggested that Perot did not alter the electoral college count, except potentially in one state (Ohio), which nonetheless showed a result in the margin of error.[43] Furthermore, Perot was most popular in states that strongly favored either Clinton or Bush, limiting his real electoral impact for either candidate.[44]
Perot gained relatively little support in the Southern states and happened to have the best showing in states with few electoral votes. Perot appealed to disaffected voters all across the political spectrum who had grown weary of the two-party system. NAFTA played a role in Perot's support, and Perot voters were relatively moderate on hot-button social issues.[45][46] A 1999 study in the American Journal of Political Science estimated that Perot's candidacy hurt the Clinton campaign, reducing "Clinton's margin of victory over Bush by seven percentage point."[47] In 2016, FiveThirtyEight noted that it was "unlikely" that Perot was a spoiler.[48]
Clinton, Bush, and Perot did not focus on abortion during the campaign. Exit polls, however, showed that attitudes toward abortion "significantly influenced" the vote, as
Implications
According to Seymour Martin Lipset, this election had several unique characteristics. Voters felt that economic conditions were worse than they actually were, which harmed Bush. A rare event was a strong third-party candidate. Liberals launched a backlash against 12 years of a conservative White House. The chief factor was Clinton's uniting his party, and winning over a number of heterogeneous groups.[51]
Clinton's election ended an era in which the Republican Party had controlled the White House for 12 consecutive years, and for 20 of the previous 24 years. The election also brought the Democrats full control of the legislative and executive branches of the federal government, including both houses of U.S. Congress and the presidency, for the first time since the administration of the last Democratic president, Jimmy Carter. This would not last for very long, however, as the Republicans won control of both the House and Senate in 1994. Reelected in 1996, Clinton would become the first Democratic President since Franklin D. Roosevelt to serve two full terms in the White House and the first to leave office at the end of his second full term since Woodrow Wilson.
1992 was arguably a political realignment election. It made the Democratic Party dominant in presidential elections in the Northeast, the Great Lakes region (until 2016) and the West Coast, where many states had previously either been swing states or Republican-leaning. Clinton picked up several states that went Republican in 1988, and which have remained in the Democratic column ever since: California, Connecticut, Delaware, Illinois, most of Maine (besides the state's second congressional district, which broke the state's total straight Democratic voting record since, when it voted for Republican presidential candidate Donald Trump in 2016), Maryland, New Jersey, and Vermont. Vermont, carried by Clinton, had been heavily Republican for generations prior to the election, voting for a Democrat only once (in 1964).[52] The state has been won by the Democratic nominee in every presidential election since. Bill Clinton narrowly defeated Bush in New Jersey (by two points), which had voted for the Republican nominee all but twice since 1948. Clinton would later win the state in 1996 by eighteen points; like Vermont, Republicans have not won the state since.[53] California, which had been a Republican stronghold since 1952, was now trending Democratic. Clinton, a native Southerner, was able to carry several states in the South that the GOP had won for much of the past two decades, but ultimately won only four of eleven former Confederate states. This reflected the final shift of the South to the Republican Party. In subsequent presidential elections from 1996 to 2020, 28 out of the 50 states were carried by the same party as in 1992 (15 for the Democrats and 13 for the Republicans).
Detailed results
| Presidential candidate | Party | Home state | Popular vote | Electoral vote |
Running mate | |||
|---|---|---|---|---|---|---|---|---|
| Count | Percentage | Vice-presidential candidate | Home state | Electoral vote | ||||
| Bill Clinton | Democratic | Arkansas | 44,909,889 | 43.01% | 370 | Al Gore | Tennessee | 370 |
| George H. W. Bush (incumbent) | Republican | Texas | 39,104,550 | 37.45% | 168 | Dan Quayle (incumbent) | Indiana | 168 |
| Ross Perot | Independent
|
Texas | 19,743,821 | 18.91% | 0 | James Stockdale | California | 0 |
| Andre Marrou | Libertarian | Alaska | 290,087 | 0.28% | 0 | Nancy Lord | Nevada | 0 |
| Bo Gritz | Populist | Nevada | 106,152 | 0.10% | 0 | Cyril Minett | New Mexico | 0 |
| Lenora Fulani | New Alliance Party | New York | 73,622 | 0.07% | 0 | Maria Elizabeth Muñoz | California | 0 |
| Howard Phillips | U.S. Taxpayers Party | Virginia | 43,369 | 0.04% | 0 | Albion W. Knight Jr. | Florida | 0 |
| Other | 152,516 | 0.13% | — | Other | — | |||
| Total | 104,423,923 | 100% | 538 | 538 | ||||
| Needed to win | 270 | 270 | ||||||
Source (Popular Vote): Leip, David. "1992 Presidential Election Results". Dave Leip's Atlas of U.S. Presidential Elections. Retrieved August 7, 2005.
Source (Electoral Vote): "Electoral College Box Scores 1789–1996". National Archives and Records Administration. Retrieved August 7, 2005.

-
 Results by county, shaded according to winning candidate's percentage of the vote
 -
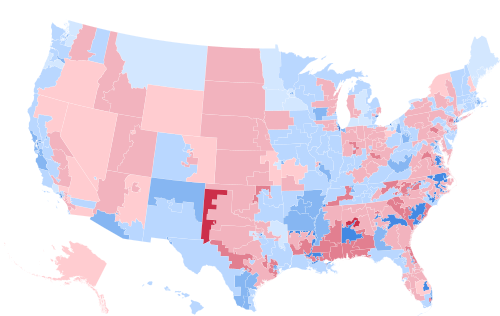 Results by congressional district, shaded according to winning candidate's percentage of the vote


Results by state
Source: [54]
| States/districts won by Clinton/Gore | |
| States/districts won by Bush/Quayle
| |
| † | At-large results (For states that split electoral votes) |
| Candidates with electoral votes (E) | Candidates with no electoral votes | Overall popular vote | |||||||||||||||
|---|---|---|---|---|---|---|---|---|---|---|---|---|---|---|---|---|---|
| Bill Clinton Democratic |
George H.W. Bush Republican |
Ross Perot Independent |
Andre Marrou Libertarian |
Others | Top-2 margin (+/− if won by D/R) |
State Total | |||||||||||
| State | E | Vote | % | E | Vote | % | E | Vote | % | Vote | % | Vote | % | Vote | % | Vote | |
| Alabama | 9 | 690,080 | 40.88 | – | 804,283 | 47.65 | 9 | 183,109 | 10.85 | 5,737 | 0.34 | 4,851 | 0.29 | −114,203 | −6.77 | 1,688,060 | AL |
| Alaska | 3 | 78,294 | 30.29 | – | 102,000 | 39.46 | 3 | 73,481 | 28.43 | 1,378 | 0.53 | 3,353 | 1.29 | −23,706 | −9.17 | 258,506 | AK |
| Arizona | 8 | 543,050 | 36.52 | – | 572,086 | 38.47 | 8 | 353,741 | 23.79 | 6,759 | 0.45 | 11,339 | 0.76 | −29,036 | −1.95 | 1,486,975 | AZ |
| Arkansas | 6 | 505,823 | 53.21 | 6 | 337,324 | 35.48 | – | 99,132 | 10.43 | 1,261 | 0.13 | 7,113 | 0.75 | 168,499 | 17.73 | 950,653 | AR |
| California | 54 | 5,121,325 | 46.01 | 54 | 3,630,574 | 32.61 | – | 2,296,006 | 20.63 | 48,139 | 0.43 | 35,677 | 0.32 | 1,490,751 | 13.40 | 11,131,721 | CA |
| Colorado | 8 | 629,681 | 40.13 | 8 | 562,850 | 35.87 | – | 366,010 | 23.32 | 8,669 | 0.55 | 1,970 | 0.13 | 66,831 | 4.26 | 1,569,180 | CO |
| Connecticut | 8 | 682,318 | 42.21 | 8 | 578,313 | 35.78 | – | 348,771 | 21.58 | 5,391 | 0.33 | 1,539 | 0.10 | 104,005 | 6.43 | 1,616,332 | CT |
| Delaware | 3 | 126,055 | 43.51 | 3 | 102,313 | 35.31 | – | 59,213 | 20.44 | 935 | 0.32 | 1,219 | 0.42 | 23,742 | 8.19 | 289,735 | DE |
| D.C. | 3 | 192,619 | 84.64 | 3 | 20,698 | 9.10 | – | 9,681 | 4.25 | 467 | 0.21 | 4,107 | 1.80 | 171,921 | 75.54 | 227,572 | DC |
| Florida | 25 | 2,072,798 | 39.00 | – | 2,173,310 | 40.89 | 25 | 1,053,067 | 19.82 | 15,079 | 0.28 | 238 | 0.00 | −100,512 | −1.89 | 5,314,392 | FL |
| Georgia | 13 | 1,008,966 | 43.47 | 13 | 995,252 | 42.88 | – | 309,657 | 13.34 | 7,110 | 0.31 | 140 | 0.01 | 13,714 | 0.59 | 2,321,125 | GA |
| Hawaii | 4 | 179,310 | 48.09 | 4 | 136,822 | 36.70 | – | 53,003 | 14.22 | 1,119 | 0.30 | 2,588 | 0.69 | 42,488 | 11.39 | 372,842 | HI |
| Idaho | 4 | 137,013 | 28.42 | – | 202,645 | 42.03 | 4 | 130,395 | 27.04 | 1,167 | 0.24 | 10,922 | 2.27 | −65,632 | −13.61 | 482,142 | ID |
| Illinois | 22 | 2,453,350 | 48.58 | 22 | 1,734,096 | 34.34 | – | 840,515 | 16.64 | 9,218 | 0.18 | 12,978 | 0.26 | 719,254 | 14.24 | 5,050,157 | IL |
| Indiana | 12 | 848,420 | 36.79 | – | 989,375 | 42.91 | 12 | 455,934 | 19.77 | 7,936 | 0.34 | 4,206 | 0.18 | −140,955 | −6.12 | 2,305,871 | IN |
| Iowa | 7 | 586,353 | 43.29 | 7 | 504,891 | 37.27 | – | 253,468 | 18.71 | 1,076 | 0.08 | 8,819 | 0.65 | 81,462 | 6.02 | 1,354,607 | IA |
| Kansas | 6 | 390,434 | 33.74 | – | 449,951 | 38.88 | 6 | 312,358 | 26.99 | 4,314 | 0.37 | 179 | 0.02 | −59,517 | −5.14 | 1,157,236 | KS |
| Kentucky | 8 | 665,104 | 44.55 | 8 | 617,178 | 41.34 | – | 203,944 | 13.66 | 4,513 | 0.30 | 2,161 | 0.14 | 47,926 | 3.21 | 1,492,900 | KY |
| Louisiana | 9 | 815,971 | 45.58 | 9 | 733,386 | 40.97 | – | 211,478 | 11.81 | 3,155 | 0.18 | 26,027 | 1.45 | 82,585 | 4.61 | 1,790,017 | LA |
| Maine † | 2 | 263,420 | 38.77 | 2 | 206,504 | 30.39 | – | 206,820 | 30.44 | 1,681 | 0.25 | 1,074 | 0.16 | 56,600 | 8.33 | 679,499 | ME |
| Maine-1 | 1 | 145,191 | 39.9 | 1 | 115,697 | 31.8 | – | 102,828 | 28.3 | – | – | – | – | 29,494 | 8.11 | 363,716 | ME1 |
| Maine-2 | 1 | 118,229 | 37.8 | 1 | 90,807 | 29.0 | – | 103,992 | 33.2 | – | – | – | – | 14,237 | 4.55 | 313,028 | ME2 |
| Maryland | 10 | 988,571 | 49.80 | 10 | 707,094 | 35.62 | – | 281,414 | 14.18 | 4,715 | 0.24 | 3,252 | 0.16 | 281,477 | 14.18 | 1,985,046 | MD |
| Massachusetts | 12 | 1,318,639 | 47.54 | 12 | 805,039 | 29.02 | – | 630,731 | 22.74 | 9,021 | 0.32 | 10,234 | 0.37 | 513,600 | 18.52 | 2,773,664 | MA |
| Michigan | 18 | 1,871,182 | 43.77 | 18 | 1,554,940 | 36.38 | – | 824,813 | 19.30 | 10,175 | 0.24 | 13,563 | 0.32 | 316,242 | 7.39 | 4,274,673 | MI |
| Minnesota | 10 | 1,020,997 | 43.48 | 10 | 747,841 | 31.85 | – | 562,506 | 23.96 | 3,373 | 0.14 | 13,230 | 0.56 | 273,156 | 11.63 | 2,347,947 | MN |
| Mississippi | 7 | 400,258 | 40.77 | – | 487,793 | 49.68 | 7 | 85,626 | 8.72 | 2,154 | 0.22 | 5,962 | 0.61 | −87,535 | −8.91 | 981,793 | MS |
| Missouri | 11 | 1,053,873 | 44.07 | 11 | 811,159 | 33.92 | – | 518,741 | 21.69 | 7,497 | 0.31 | 295 | 0.01 | 242,714 | 10.15 | 2,391,565 | MO |
| Montana | 3 | 154,507 | 37.63 | 3 | 144,207 | 35.12 | – | 107,225 | 26.11 | 986 | 0.24 | 3,686 | 0.90 | 10,300 | 2.51 | 410,611 | MT |
| Nebraska † | 2 | 217,344 | 29.40 | – | 344,346 | 46.58 | 2 | 174,687 | 23.63 | 1,344 | 0.18 | 1,562 | 0.21 | −127,002 | −17.18 | 739,283 | NE |
| Nebraska-1 | 1 | 80,696 | 32.6 | – | 107,081 | 43.2 | 1 | 59,974 | 24.2 | – | – | – | – | -28,847 | -10.6 | 247,751 | NE1 |
| Nebraska-2 | 1 | 78,701 | 32.4 | – | 115,255 | 47.5 | 1 | 48,657 | 20.1 | – | – | – | – | -32,226 | -15.1 | 242,613 | NE2 |
| Nebraska-3 | 1 | 57,467 | 23.5 | – | 121,342 | 49.7 | 1 | 65,473 | 26.8 | – | – | – | – | -55,869 | -26.1 | 244,282 | NE3 |
| Nevada | 4 | 189,148 | 37.36 | 4 | 175,828 | 34.73 | – | 132,580 | 26.19 | 1,835 | 0.36 | 6,927 | 1.37 | 13,320 | 2.63 | 506,318 | NV |
| New Hampshire | 4 | 209,040 | 38.86 | 4 | 202,484 | 37.64 | – | 121,337 | 22.56 | 3,548 | 0.66 | 1,536 | 0.29 | 6,556 | 1.22 | 537,945 | NH |
| New Jersey | 15 | 1,436,206 | 42.95 | 15 | 1,356,865 | 40.58 | – | 521,829 | 15.61 | 6,822 | 0.20 | 21,872 | 0.65 | 79,341 | 2.37 | 3,343,594 | NJ |
| New Mexico | 5 | 261,617 | 45.90 | 5 | 212,824 | 37.34 | – | 91,895 | 16.12 | 1,615 | 0.28 | 2,035 | 0.36 | 48,793 | 8.56 | 569,986 | NM |
| New York | 33 | 3,444,450 | 49.72 | 33 | 2,346,649 | 33.88 | – | 1,090,721 | 15.75 | 13,451 | 0.19 | 31,662 | 0.46 | 1,097,801 | 15.85 | 6,926,933 | NY |
| North Carolina | 14 | 1,114,042 | 42.65 | – | 1,134,661 | 43.44 | 14 | 357,864 | 13.70 | 5,171 | 0.20 | 112 | 0.00 | −20,619 | −0.79 | 2,611,850 | NC |
| North Dakota | 3 | 99,168 | 32.18 | – | 136,244 | 44.22 | 3 | 71,084 | 23.07 | 416 | 0.14 | 1,221 | 0.40 | −37,076 | −12.04 | 308,133 | ND |
| Ohio | 21 | 1,984,942 | 40.18 | 21 | 1,894,310 | 38.35 | – | 1,036,426 | 20.98 | 7,252 | 0.15 | 17,034 | 0.34 | 90,632 | 1.83 | 4,939,964 | OH |
| Oklahoma | 8 | 473,066 | 34.02 | – | 592,929 | 42.65 | 8 | 319,878 | 23.01 | 4,486 | 0.32 | – | – | −119,863 | −8.63 | 1,390,359 | OK |
| Oregon | 7 | 621,314 | 42.48 | 7 | 475,757 | 32.53 | – | 354,091 | 24.21 | 4,277 | 0.29 | 7,204 | 0.49 | 145,557 | 9.95 | 1,462,643 | OR |
| Pennsylvania | 23 | 2,239,164 | 45.15 | 23 | 1,791,841 | 36.13 | – | 902,667 | 18.20 | 21,477 | 0.43 | 4,661 | 0.09 | 447,323 | 9.02 | 4,959,810 | PA |
| Rhode Island | 4 | 213,302 | 47.04 | 4 | 131,601 | 29.02 | – | 105,045 | 23.16 | 571 | 0.13 | 2,959 | 0.65 | 81,701 | 18.02 | 453,478 | RI |
| South Carolina | 8 | 479,514 | 39.88 | – | 577,507 | 48.02 | 8 | 138,872 | 11.55 | 2,719 | 0.23 | 3,915 | 0.33 | −97,993 | −8.14 | 1,202,527 | SC |
| South Dakota | 3 | 124,888 | 37.14 | – | 136,718 | 40.66 | 3 | 73,295 | 21.80 | 814 | 0.24 | 539 | 0.16 | −11,830 | −3.52 | 336,254 | SD |
| Tennessee | 11 | 933,521 | 47.08 | 11 | 841,300 | 42.43 | – | 199,968 | 10.09 | 1,847 | 0.09 | 6,002 | 0.30 | 92,221 | 4.65 | 1,982,638 | TN |
| Texas | 32 | 2,281,815 | 37.08 | – | 2,496,071 | 40.56 | 32 | 1,354,781 | 22.01 | 19,699 | 0.32 | 1,652 | 0.03 | −214,256 | −3.48 | 6,154,018 | TX |
| Utah | 5 | 183,429 | 24.65 | – | 322,632 | 43.36 | 5 | 203,400 | 27.34 | 1,900 | 0.26 | 32,638 | 4.39 | −119,232 | −16.03 | 743,999 | UT |
| Vermont | 3 | 133,592 | 46.11 | 3 | 88,122 | 30.42 | – | 65,991 | 22.78 | 501 | 0.17 | 1,495 | 0.52 | 45,470 | 15.70 | 289,701 | VT |
| Virginia | 13 | 1,038,650 | 40.59 | – | 1,150,517 | 44.97 | 13 | 348,639 | 13.63 | 5,730 | 0.22 | 15,129 | 0.59 | −111,867 | −4.38 | 2,558,665 | VA |
| Washington | 11 | 993,039 | 43.40 | 11 | 731,235 | 31.96 | – | 541,780 | 23.68 | 7,533 | 0.33 | 14,641 | 0.64 | 261,804 | 11.44 | 2,288,228 | WA |
| West Virginia | 5 | 331,001 | 48.41 | 5 | 241,974 | 35.39 | – | 108,829 | 15.91 | 1,873 | 0.27 | – | – | 89,027 | 13.02 | 683,677 | WV |
| Wisconsin | 11 | 1,041,066 | 41.13 | 11 | 930,855 | 36.78 | – | 544,479 | 21.51 | 2,877 | 0.11 | 11,837 | 0.47 | 110,211 | 4.35 | 2,531,114 | WI |
| Wyoming | 3 | 68,160 | 33.98 | – | 79,347 | 39.56 | 3 | 51,263 | 25.56 | 844 | 0.42 | 973 | 0.49 | −11,187 | −5.58 | 200,587 | WY |
| TOTALS: | 538 | 44,909,889 | 43.01 | 370 | 39,104,545 | 37.45 | 168 | 19,742,267 | 18.91 | 291,628 | 0.28 | 378,330 | 0.36 | 5,805,344 | 5.56 | 104,426,659 | US |
†Maine and Nebraska each allowed their electoral votes to be split between candidates using the Congressional District Method for electoral vote assignment. In both states, two electoral votes were awarded to the winner of the statewide race and one electoral vote was awarded to the winner of each congressional district.[55] District results for Maine and Nebraska do not include results for Marrou or other candidates and so totals differ from those for the states' at-large. Because Perot finished in 2nd place in some districts, the margins of the districts do not match the margin at-large. Nebraska split its electoral votes this way for the first time.
States that flipped from Republican to Democratic
- Arkansas
- California
- Colorado
- Connecticut
- Delaware
- Georgia
- Illinois
- Kentucky
- Louisiana
- Maine
- Maryland
- Michigan
- Missouri
- Montana
- Nevada
- New Jersey
- New Hampshire
- New Mexico
- Ohio
- Pennsylvania
- Tennessee
- Vermont
Close states
States with margin of victory less than 1% (27 electoral votes):
- Georgia – 0.59% (13,714 votes)
- North Carolina – 0.79% (20,619 votes)
States/Districts with margin of victory less than 5% (175 electoral votes):
- New Hampshire – 1.22% (6,556 votes)
- Ohio – 1.83% (90,632 votes)
- Florida – 1.89% (100,612 votes)
- Arizona – 1.95% (29,036 votes)
- New Jersey – 2.37% (79,341 votes)
- Montana – 2.51% (10,300 votes)
- Nevada – 2.63% (13,320 votes)
- Kentucky – 3.21% (47,926 votes)
- Texas – 3.48% (214,256 votes)
- South Dakota – 3.52% (11,830 votes)
- Colorado – 4.26% (66,831 votes)
- Wisconsin – 4.35% (110,211 votes)
- Virginia – 4.37% (111,867 votes)
- Maine's 2nd Congressional District – 4.54% (14,237 votes) (margin over Ross Perot)
- Louisiana – 4.61% (82,585 votes)
- Tennessee – 4.65% (92,221 votes) (tipping point state)
States with margin of victory between 5% and 10% (131 electoral votes):
- Kansas – 5.14% (59,517 votes)
- Wyoming – 5.60% (11,187 votes)
- Iowa – 6.02% (81,462 votes)
- Indiana – 6.12% (140,955 votes)
- Connecticut – 6.43% (104,005 votes)
- Alabama – 6.77% (114,203 votes)
- Michigan – 7.39% (316,242 votes)
- South Carolina – 8.14% (97,993 votes)
- Maine's 1st Congressional District – 8.11% (29,494 votes)
- Delaware – 8.19% (23,741 votes)
- Maine – 8.33% (56,600 votes) (margin over Ross Perot)
- New Mexico – 8.56% (48,793 votes)
- Oklahoma – 8.63% (119,863 votes)
- Mississippi – 8.91% (87,535 votes)
- Pennsylvania – 9.02% (447,323 votes)
- Alaska – 9.17% (23,706 votes)
- Oregon – 9.95% (145,557 votes)
Source: New York Times President Map
Statistics
Counties with Highest Percent of Vote (Democratic)
- Washington, D.C. 84.64%
- Starr County, Texas 82.80%
- Macon County, Alabama 82.78%
- Duval County, Texas 79.56%
- Jefferson County, Mississippi 79.39%
Counties with Highest Percent of Vote (Republican)
- Jackson County, Kentucky 74.96%
- Sioux County, Iowa 72.21%
- Hansford County, Texas 69.08%
- Ochiltree County, Texas 68.06%
- Shelby County, Alabama 67.97%
Counties with Highest Percent of Vote (Other)
- Loving County, Texas 46.88%
- San Juan County, Colorado 40.40%
- Billings County, North Dakota 39.82%
- Somerset County, Maine 38.95%
- Esmeralda County, Nevada 37.67%
Voter demographics
| Presidential vote in social groups (in percentage) | ||||
|---|---|---|---|---|
| Social group | Clinton | Bush | Perot | % of total vote |
| Total vote | 43 | 37 | 19 | 100 |
| Party and ideology | ||||
| Conservative Republicans | 5 | 82 | 13 | 21 |
| Moderate Republicans | 16 | 63 | 21 | 13 |
| Liberal Republicans | 16 | 54 | 30 | 2 |
| Conservative Independents | 17 | 53 | 30 | 7 |
| Moderate Independents | 42 | 28 | 30 | 15 |
| Liberal Independents | 54 | 16 | 29 | 4 |
| Conservative Democrats | 61 | 23 | 16 | 6 |
| Moderate Democrats | 76 | 9 | 15 | 20 |
| Liberal Democrats | 85 | 11 | 5 | 13 |
| Gender and marital status | ||||
| Married men | 37 | 42 | 21 | 33 |
| Married women | 41 | 40 | 19 | 33 |
| Unmarried men | 48 | 29 | 22 | 15 |
| Unmarried women | 53 | 31 | 15 | 19 |
| Race | ||||
| White | 39 | 40 | 20 | 84 |
| Black | 83 | 10 | 7 | 10 |
| Hispanic | 61 | 25 | 14 | 4 |
| Asian | 30 | 55 | 15 | 1 |
| Religion | ||||
| White Protestant | 32 | 47 | 21 | 46 |
| Catholic | 44 | 35 | 20 | 29 |
| Jewish | 80 | 11 | 9 | 3 |
| Born Again, religious right | 23 | 61 | 15 | 17 |
| Age | ||||
| 18–29 years old | 43 | 34 | 22 | 17 |
| 30–44 years old | 41 | 38 | 21 | 33 |
| 45–59 years old | 41 | 40 | 19 | 26 |
| 60 and older | 50 | 38 | 12 | 24 |
| Education | ||||
| Not a high school graduate | 54 | 28 | 18 | 6 |
| High school graduate | 43 | 36 | 21 | 24 |
| Some college education | 41 | 37 | 21 | 27 |
| College graduate | 39 | 41 | 20 | 26 |
| Post graduate education | 50 | 36 | 14 | 17 |
| Family income | ||||
| Under $15,000 | 58 | 23 | 19 | 13 |
| $15,000–29,999 | 45 | 35 | 20 | 27 |
| $30,000–49,999 | 41 | 38 | 21 | 26 |
| $50,000-$75,000 | 41 | 42 | 17 | 19 |
| Over $75,000 | 36 | 48 | 16 | 15 |
| Region | ||||
| East | 47 | 35 | 18 | 23 |
| Midwest | 42 | 37 | 21 | 26 |
| South | 41 | 43 | 16 | 30 |
| West | 43 | 34 | 23 | 20 |
| Community size | ||||
| Population over 500,000 | 58 | 28 | 13 | 10 |
| Population 50,000 to 500,000 | 50 | 33 | 16 | 21 |
| Suburbs | 40 | 39 | 21 | 39 |
| Rural areas, towns | 39 | 40 | 20 | 30 |
Source: Voter News Service exit poll, reported in The New York Times, November 10, 1996, 28.
See also
- Newspaper endorsements in the 1992 United States presidential election
- Chicken George
- "Giant sucking sound"
- "It's the economy, stupid"
- "Read my lips: no new taxes"
- 1992 United States gubernatorial elections
- 1992 United States Senate elections
- 1992 United States House of Representatives elections
- Presidency of Bill Clinton
References
- ^ "National General Election VEP Turnout Rates, 1789-Present". United States Election Project. CQ Press.
- ^ Clines, F (March 14, 1998). "Testing of a President: the Accuser; Jones Lawyers Issue Files Alleging Clinton Pattern of Harassment of Women". The New York Times. Retrieved March 20, 2008.
the President, though finally confirming a sexual encounter with Ms. Flowers
- ^ Purnick, Joyce; Oreskes, Michael (November 29, 1987). "Jesse Jackson Aims for the Mainstream". The New York Times. Retrieved October 1, 2012.
- ^ Ifill, Gwen (July 10, 1992), "Clinton Selects Senator Gore Of Tennessee As Running Mate", The New York Times
- ^ Al Gore, United States Senate
- ^ "CHAPTER 13: Toward the 21st Century". usinfo.state.gov. Archived from the original on November 3, 2004. Retrieved June 2, 2022.
- ISBN 978-1-60426-536-1.
- ^ a b "The 1992 Campaign: On the Trail; Poll Gives Perot a Clear Lead", The New York Times, June 11, 1992
- ^ Berke, Richard L. (October 26, 1992), "The 1992 Campaign: The Overview; Perot Says He Quit In July To Thwart G.O.P. 'Dirty Tricks'", The New York Times
- ^ ISBN 0-02-864623-1.
- ^ LoudounNow (February 18, 2019). "Perennial Presidential Candidate LaRouche Dies at 96". Loudoun Now. Retrieved February 8, 2021.
- ^ Kolbert, Elizabeth (February 18, 1992), "In Nader's Campaign, White House Isn't the Goal", The New York Times
- ^ Toner, Robin (March 3, 1992), "Voters Are Unhappy With All the Choices", The New York Times
- ^ Toner, Robin (April 1, 1992), "Clinton Dogged By Voter Doubt, Poll of U.S. Says", The New York Times
- ^ Toner, Robin (April 26, 1992), "Poll Shows Perot Gaining Strength To Rival Clinton's", The New York Times
- ^ Toner, Robin (June 23, 1992), "Bush and Clinton Sag in Survey; Perot's Negative Rating Doubles", The New York Times
- ^ "Their Own Words; Excerpts From Clinton's and Gore's Remarks on the Ticket", The New York Times, July 10, 1992
- ^ "Captain Perot Jumps Ship", The New York Times, July 17, 1992
- ^ "William J. Clinton: Address Accepting the Presidential Nomination at the Democratic National Convention in New York". Presidency.ucsb.edu. July 16, 1992. Retrieved August 18, 2016.
- ^ Apple, R. W. Jr. (July 18, 1992), "Poll Gives Clinton a Post-Perot, Post-Convention Boost", The New York Times
- ^ Miller, Judith (August 16, 1992), "The Republicans: Can They Get It Together?", The New York Times
- ^ "Bush Trails, to Varying Degrees, in 3 Polls", The New York Times, August 17, 1992
- ^ Clymer, Adam (August 26, 1992), "Bush's Gains From Convention Nearly Evaporate in Latest Poll", The New York Times
- ^ "Clinton Takes 21-Point Lead Over President in a New Poll", The New York Times, September 22, 1992
- ^ Toner, Robin (September 30, 1992), "Campaign Strategy; 2 Camps Regard A Perot Revival With Less Fear", The New York Times
- ^ Toner, Robin (October 25, 1992), "Contest Tightens As Perot Resurges And Clinton Slips", The New York Times
- ^ a b c d e "CPD: 1992 Debates". www.debates.org. Retrieved January 8, 2019.
- ^ Conason, Joe (July/August 1992). "Reason No. 1 Not To Vote For Bill Clinton: He Cheats on His Wife." Spy magazine.
- ^ Kurtz, Howard (August 12, 1992). "Clinton Angrily Denounces Report of Extramarital Affair as 'a Lie.'" The Washington Post.
- ^ Kornacki, Steve (January 21, 2011). "Why the 'good' Iraq war wasn't so good" Archived January 26, 2011, at the Wayback Machine. Salon.
- ^ Dionne, E.J. (June 9, 1992). "PEROT LEADS IN NEW POLL". Washington Post. Retrieved February 8, 2021.
- ^ Topics at a Glance—iPOLL summary results, archived from the original on September 18, 2008, retrieved August 27, 2008
- ^ Toner, Robin (November 11, 1992), "The Republicans; Looking to the Future, Party Sifts Through Past", The New York Times
- ^ Fineman, Howard (September 15, 1991). "Bush: The Churchill Scenario". Newsweek. Retrieved February 11, 2024.
- ^ Mitchell, Alison (January 27, 1996). "CLINTON'S ADVISERS; Sharp Split Over Issues: Economics Or Values?". The New York Times.
- ^ Shapiro, Walter (November 16, 1992). "Baby-boomer Bill Clinton: A Generation Takes Power". Time.
- ^ "THE 1992 ELECTIONS: DISAPPOINTMENT -- NEWS ANALYSIS An Eccentric but No Joke; Perot's Strong Showing Raises Questions On What Might Have Been, and Might Be". The New York Times. November 5, 1992.
- ^ Los Angeles Times. Los Angeles Times Exit Poll 1992, Nov 1992 [survey question]. USLAT.92EXIT.QN. Los Angeles Times [producer]. Storrs, CT:Roper Center for Public Opinion Research, iPOLL [distributor], accessed Jul 20, 2015.
- ^ ABC News, CBS News, CNN, NBC News. VRS Election Day Exit Poll 1992, Nov 1992 [survey question]. USVRS.92EXIT.Q08. Voter Research & Surveys [producer]. Storrs, CT:Roper Center for Public Opinion Research, iPOLL [distributor], accessed Jul 20, 2015.
- ^ "Plurality Wins in the 1992 Presidential Race: Perot's Contribution to Clinton's Victory". Archive.fairvote.org. Retrieved August 18, 2016.
- ^ Schmalz, Jeffrey (November 4, 1992), "Clinton Carves a Path Deep Into Reagan Country", The New York Times
- ^ 1992 Presidential Election – What if Scenario
- ^ E.J. Dionne Jr. (November 8, 1992). "Perot Seen Not Affecting Vote Outcome". The Washington Post. Retrieved August 18, 2016.
- ^ AARON W. BROWN (February 23, 2013). "H. Ross Perot and George C. Wallace: Defining the Archetype of Third-party "Success" in Presidential Elections" (PDF). Digitalcommons.northgeorgia.edu. Retrieved August 18, 2016.
- ^ Public Opinion Watch, archived from the original on August 23, 2009
- ^ Mishel, Lawrence; Teixeira, Ruy A. (December 30, 1998), The Political Arithmetic of the NAFTA Vote (PDF), archived from the original (PDF) on November 28, 2008
- JSTOR 2991792.
- ^ Druke, Galen (October 24, 2016). "Long Before Trump, There Was Ross Perot". FiveThirtyEight. Retrieved May 9, 2021.
- ISBN 978-0-19-504657-1
- ^ Abramowitz (1995)
- ^ Seymour Martin Lipset, "The significance of the 1992 election." PS: Political Science and Politics 26.1 (1993): 7-16 online
- ^ "Vermont Presidential Election Voting History". 270towin.com. Retrieved August 18, 2016.
- ^ "Surprise Swing States". CBS News. February 11, 2009. Retrieved October 3, 2013.
- ^ "1992 Presidential General Election Data – National". Uselectionatlas.org. Retrieved February 11, 2012.
- ^ Barone, Michael; Ujifusa, Grant (July 1999). The Almanac of American Politics 2000. Crown Publishing Group.
- ^ "1992 Presidential General Election Data – National". Uselectionatlas.org. Retrieved February 11, 2012.
- "Outline of U.S. History: Chapter 15: Bridge to the 21st century". Official web site of the U.S. Department of State. Archived from the original on December 14, 2005. Retrieved December 10, 2005.
- Bulk of article text as of January 9, 2003 copied from this page, when it was located at http://usinfo.state.gov/usa/infousa/facts/history/ch13.htm#1992 and titled "An Outline of American History: Chapter 13: Toward the 21st century".
- An archival version of this page is available at the Wayback Machine (archived November 3, 2004)
- This page is in the public domain as a government publication.
Further reading
- Abramowitz, Alan I. (1995), "It's Abortion, Stupid: Policy Voting in the 1992 Presidential Election", Journal of Politics, 57 (1): 176–186, S2CID 155087138
- Alexander, Herbert E.; Corrado, Anthony (1995), Financing the 1992 Election, Armonk: Sharpe, ISBN 978-1-56324-437-7
- Buell Jr, Emmett H. "The 1992 Elections." Journal of Politics (1994): 1133-1144; reviews leading political science studies of the election
- Ceaser, James, and Andrew Busch. Upside Down and Inside Out: The 1992 Elections and American Politics (1993).
- Crotty, William, ed. America's Choice: The Election of 1992 (1993)
- DeFrank, Thomas M.; et al. (1994), Quest for the Presidency, 1992, College Station: Texas A&M University Press, ISBN 978-0-89096-644-0
- De la Garza, Rodolfo O.; Desipio, Louis (1996), Ethnic Ironies: Latino Politics in the 1992 Elections, Boulder: Westview, ISBN 978-0-8133-8910-3
- Doherty, Kathryn M., and James G. Gimpel. "Candidate Character vs. the Economy in the 1992 Election." Political Behavior 19.3 (1997): 177-196. online
- Germond, Jack, and Jules Witcover. Mad As Hell: Revolt at the Ballot Box, 1992 (1993). online
- Goldman, Peter. et al. Quest for the Presidency 1992 (1994) 805pp.
- Herron, Michael C., et al. "Measurement of political effects in the United States economy: A study of the 1992 presidential election." Economics & Politics 11.1 (1999): 51-81.
- Lacy, Dean; Burden, Barry C. (1999), "The Vote-Stealing and Turnout Effects of Ross Perot in the 1992 U.S. Presidential Election", American Journal of Political Science, 43 (1): 233–255, JSTOR 2991792
- Johnstone, Andrew, and Andrew Priest, eds. US Presidential Elections and Foreign Policy: Candidates, Campaigns, and Global Politics from FDR to Bill Clinton (2017) pp 317–225. online
- Jones, Bryan D. (1995), The New American Politics: Reflections on Political Change and the Clinton Administration, Boulder: Westview, ISBN 978-0-8133-1972-8
- Kellstedt, Lyman A., et al. "Religious voting blocs in the 1992 election: The year of the evangelical?." Sociology of Religion 55.3 (1994): 307-326. [Kellstedt, Lyman A., et al. "Religious voting blocs in the 1992 election: The year of the evangelical?." Sociology of Religion 55.3 (1994): 307-326. online]
- Klein, Jill Gabrielle. "Negativity in impressions of presidential candidates revisited: The 1992 election." Personality and Social Psychology Bulletin 22.3 (1996): 288-295.
- Ladd, Everett Carll. "The 1992 vote for President Clinton: Another brittle mandate?." Political Science Quarterly 108.1 (1993): 1-28. online
- Lipset, Seymour Martin. "The significance of the 1992 election." PS: Political Science and Politics 26.1 (1993): 7-16. online
- Nelson, Michael ed. The Elections of 1992 (1993)
- Nelson, Michael. Clinton's Elections: 1992, 1996, and the Birth of a New Era of Governance (2020) excerpt
- O'Mara, Margaret. Pivotal Tuesdays: Four Elections That Shaped the Twentieth Century (2015), compares 1912, 1932, 1968, 1992 in terms of social, economic, and political history
- Ornstein, Norman J. "Foreign policy and the 1992 election." Foreign Affairs 71.3 (1992): 1-16. online
- Pomper, Gerald M. ed. The Election of 1992 (1993).
- Post, Jerrold M. "The Political psychology of the Ross Perot phenomenon." in The Clinton Presidency (Routledge, 2019. 37-56).
- Rosenstiel, Tom. (1993), Strange Bedfellows: How Television and the Presidential Candidates Changed American Politics, 1992, New York: Hyperion, ISBN 978-1-56282-859-2
- Steed, Robert P. (1994), The 1992 Presidential Election in the South: Current Patterns of Southern Party and Electoral Politics, Westport: Praeger, ISBN 978-0-275-94534-3
- Troy, Gil. "Stumping in the bookstores: A literary history of the 1992 presidential campaign." Presidential Studies Quarterly (1995): 697-710. online
- Weaver, David, and Dan Drew. "Voter learning in the 1992 presidential election: Did the “nontraditional” media and debates matter?." Journalism & Mass Communication Quarterly 72.1 (1995): 7-17.
Political commentary and campaign statements
- Barlett, Donald L. and James B. Steele. America: What Went Wrong? (1992) online.
- Clinton, Bill, and Al Gore. Putting People First: How We Can All Change America (1992)
- Cramer, Richard Ben. What It Takes: The Way to the White House (1992). online.
- Dionne, E. J. Why Americans Hate Politics (1992). online
- Duffy, Michael, and Dan Goodgame. Marching in Place: The Status Quo Presidency of George Bush (1992) online.
- Edsall Thomas Byrne, and Mary D. Edsall. Chain Reaction: The Impact of Race, Rights, and Taxes on American Politics (1992) online.
- Ehrenhalt, Alan. The United States of Ambition: Politicians, Power, and the Pursuit of Office (1992) online.
- Gore, Al. Earth in the Balance: Ecology and the Human Spirit (1992). online
- Greider, William. Who Will Tell the People: The Betrayal of American Democracy (1992) online.
- Jamieson, Kathleen Hall. Dirty Politics: Deception, Distraction, and Democracy (1992) online.
- Perot, Ross. United We Stand: How We Can Take Back Our Country (1992) online.
- Phillips, Kevin. The Politics of Rich and Poor: Wealth and the American Electorate in the Reagan Aftermath (1992) online.
- Sabato, Larry J. Feeding Frenzy: How Attack Journalism Has Transformed American Politics (1991) online
- Will, George F. Restoration: Congress, Term Limits and the Recovery of Deliberative Democracy (1992) online.
External links
- The Election Wall's 1992 Election Video Page
- 1992 popular vote by counties
- 1992 popular vote by state
- 1992 popular vote by states (with bar graphs)
- Presidential Campaign Commercials, C-SPAN
- Campaign commercials from the 1992 election
- Film footage of Gore speech on the election campaign trail on YouTube
- Booknotes interview with Tom Rosenstiel on Strange Bedfellows: How Television and the Presidential Candidates Changed American Politics, 1992, August 8, 1993.
- Election of 1992 in Counting the Votes