
Demographic history of Bosnia and Herzegovina
This article needs additional citations for verification. (November 2009) |

This article is about the Demographic history of Bosnia and Herzegovina, and deals with the country's documented demographics over time. For an overview of the various ethnic groups and their historical development, see Ethnic groups in Bosnia and Herzegovina.
Overview
| Census | Population | Change | Area (km2) | Density (pop. per km2) | Note |
|---|---|---|---|---|---|
| 1879 | 1,158,440 | — | 51,246 | 22.6 | As part of Austria-Hungary (1878–1918) |
| 1885 | 1,336,091 | +15.3% | 51,246 | 26.1 | |
| 1895 | 1,568,092 | +17.4% | 51,246 | 30.6 | |
| 1910 | 1,898,044 | +21.0% | 51,200 | 37.1 | |
| 1921 | 1,890,440 | –0.4% | 51,200 | 36.9 | As part of Kingdom of Yugoslavia (1918–1941) |
| 1931 | 2,323,555 | +22.9% | 51,564 | 45.1 | |
| 1948 | 2,564,308 | +10.4% | 51,189 | 50.1 | As SR Bosnia and Herzegovina within SFR Yugoslavia (1945–1992) |
| 1953 | 2,847,459 | +11.0% | 51,221 | 55.6 | |
| 1961 | 3,277,948 | +15.1% | 51,197 | 64.0 | |
| 1971 | 3,746,111 | +14.3% | 51,197 | 73.2 | |
| 1981 | 4,124,256 | +10.1% | 51,197 | 80.6 | |
| 1991 | 4,377,033 | +6.1% | 51,197 | 85.5 | |
| 2001 † | 3,922,205 | –10.4% | 51,197 | 76.6 | As Bosnia and Herzegovina (1992–present) |
| 2013 | 3,531,159 | –9.9% | 51,197 | 68.9 | |
| † = Estimate. ‡ = Preliminary results. Sources: For period 1879–1991, Institute for Statistics of Federation of Bosnia and Herzegovina;[1] For 2001 and 2011, various editions of Central Intelligence Agency's publication The World Factbook. | |||||
Prehistoric
The highest concentration of Haplogroup I-M170, the only native European Haplogroup, is found in present-day Bosnia and Herzegovina, ranging from 65% to 73%.
Medieval
Due to a variety of factors (such as frequent boundary shifts and a relative isolation from the rest of Europe) there are no detailed statistics dealing with Bosnia's population during the
In the late 15th century, there was at least 35,000 Vlach homes in the area of Herzegovina.[4]
Migrations and other
Throughout the 15th–19th centuries there were many demographic changes. Frequent wars, religious persecutions, rebellions, uprisings, taking of children as tribute, high
In the Bosnia proper the population started to move out first from lower regions (Posavina and the river valleys) and then from highlands. The most intensive migration flows originated in the karst Dinaric regions of Herzegovina and western Bosnia. For centuries, the population from these regions, mostly Christian, headed towards surrounding countries):
- The migrations from Baranja.
- Migrations from eastern Herzegovina and Upper Podrinje headed towards western Serbia and Šumadija.
- Migrations from the southern Dinaric region of Bosnia and Herzegovina headed towards Dalmatia. Bukovicaoriginated from Bosnia and Herzegovina.
- Of the Herzegovina origin were the inhabitants of the city of Dubrovnik and the vicinity, while the population of the Bay of Kotor originated from the Montenegrin and Herzegovina Dinaric regions.
Throughout the 15th–19th centuries, with coming of the Ottoman Empire on the territory of Bosnia and Herzegovina the first significant demographic change took place as almost all followers of than
Preottoman Catholic population had a great share in the emigrations from Bosnia and Herzegovina. The emigration flows were directed towards Dalmatia,
According to the findings of many an author, the Muslim population, in the period of the Ottoman rule, did not emigrate much compared to the migrations of the Eastern Orthodox and Catholic population. The Muslim population was characteristic of return migrations as soon as the political and economic situation again became stable or the state borders were shifted. The return movements of the Muslim population from the seaside,
In the Ottoman period, the Muslim population increased in number in Bosnia and Herzegovina somewhat due to immigrations of Muslims from the
However, the increase of the Muslim population was mostly due to their high natality rate given the patriarchal nature of the family structure. In such family structure the duties of the family members were strictly divided where female members of the family almost solely were bearing many children and taking care of the household while male members were engaged in running the land and the politics of the community.
Patriarchal structure was also evident in Eastern Orthodox and Catholic families but the statistics do not tend to show as high natality rates. The difference (according to some literary sources of the time) was in the social levels of Muslims relative to their Christian counterparts where the former were landowners and hence upper and upper middle class who could afford to have more offspring and the latter were land workers and hence lower middle to lower class. Such social organization corresponded to a
Ottoman Empire
During and shortly after the
The first official population census by religion in Bosnia conducted:
| Number | Type |
|---|---|
| 37,125 | Christian houses |
| 332 | Muslim houses |
In 1489, the official population census by religion for Bosnian Sanjak was:
| Number | Type |
|---|---|
| 25,068 | Christian houses |
| 4,485 | Muslim houses |
Contemporary Byzantine historian Michael Critobulus of Imbros described Bosnia and its endings in the first half of the 15th century. He calls Bosnia "land of Vostri" and its population Vostri (or Bostri, Bostni), clearly distinguishing Bosnia population from populations of its neighbors, which Serbian scholar Radivoj Radić cites and explains in his study Bosnia in historical work of Critobulus of Imbros,[6] citing author who calls Bosnians by the name of "Vostri", Albanians by the name of "Illirians", and Serbs by the name of "Tribali".[7][8]
Turkish historian Ömer Lütfü Barkan conducted a population census based on religion in the Sanjak of Bosnia between 1520 and 1530. At that time, there were over 334,325 inhabitants, of whom 38,7% were followers of Islam.
During the late 16th century and early 17th century, according to various
The Muslim population of Bosnia and Herzegovina, during the late 18th century to the early 19th century, started to gradually drop due to frequent wars fought by the Ottoman Empire. Muslims were required by Ottoman law to serve in the military, whereas Christians were not part of the army. With the created of independent states of Serbia and Montenegro, migrations of Serbs to the two states were in massive waves in the 1810s, 1820s and 1870s.[citation needed]
Both
It is impossible to give a correct estimate of the population of Bosnia at the time.Numbers vary from a million, others at 920,000 and 840,000. Leopold von Zedlitz-Neukirch [1], in his "Blicke auf Bosnien, Rascien, die Herzegewina und Servien, bei der Fortsetzung des Russisch-Türkischen Krieges im Jahre 1829", gives us in one portion of his work the following estimates:
- Bosniaks – 250,000
- Serbians – 120,000
- Turks – 240,000
- Morlachs – 75,000
- Croats – 40,000
- Gypsies – 16,000
- Jews – 2,000
- Armenians – 800
Making a total of 743,800.
- 450,000 Muslims
- 250,000 Catholics
- 220,000 Eastern Orthodox
- 2,000 Jews
- 800 Armenians
Johann Roskiewicz estimated the ethnic composition of the population in 1867 as:
- In Bosnia:
- 782,000 Slavs
- 9,000 Roma
- 5,000 Jews
- In Herzegovina:
- 227,000 Slavs
- 2,500 Roma
- 500 Jews
In the 1871 population census done by the Ottoman Empire in the Bosnia Vilayet, the census says:
| Type | Percentage range |
|---|---|
Eastern Orthodox Christians
|
37% |
Sunni Muslims
|
50% |
Catholic Christians
|
13% |
Between 1875 and 1876, an Ottoman population census by religion was conducted, but with vague, imprecise and varying figures:[citation needed]
| Type | Percentage range |
|---|---|
Eastern Orthodox Christians
|
32.63% – 46.6% |
Sunni Muslims
|
32.6% – 51.9% |
Catholic Christians
|
14.97% – 20.17% |
New empire created mostly Muslim elites which made up the majority in most of the cities, as in the westernmost and easternmost of Bosnia (Cazin area, parts of Drina valley and larger area around Tuzla). Number of Catholic dropped in northern Bosnia (except for large parts of Bosnian Posavina), in central Bosnia Catholics dropped roughly to about one half of the population, and in Herzegovina Catholic and Orthodox were majority west and east of the Neretva, with a Muslim majority in most of the settlements.[citation needed]
Territorial distribution
The Muslim population was mostly urban and comprised the majority in most of Bosnia and Herzegovina towns (Sarajevo, Tuzla, Banja Luka) as in western (Cazin and along the Una valley (Pounje)) and eastern (along the Drina valley) border areas of the country. In general, Muslims were the dominant group in most developed urban centers of the country.
Parts of Bosanska Krajina with parts of Western Bosnia, parts of Eastern Herzegovina and across the Drina river toward Serbia border had Eastern Orthodox majority. These are mostly mountainous regions. The re-establishment of the Serbian Patriarchate of Peć in 1557, shortage of catholic priesthood, and general Ottoman tolerance,[10] especially for Orthodox Christianity, contributed greatly to enlargement and maintenance of Orthodox population, later Serbs in these areas.
The Catholic population comprised majority in parts of the Herzegovina, Posavina and Central Bosnia.
Due to the frequent migrations and wars, population in many areas of the country was mixed, containing people of different religions.
Bosnia accepted a wave of immigrants of Jews that were expelled from Spain since the 15th century.
During the popular uprisings between 1875 and 1878, Bosnia and Herzegovina lost 13,64% of its population (150,000 out of total 1,100,000).
Austro-Hungarian Empire
1879 census
The Austro-Hungarian government published the Haupt-Uebersicht der politischen Eintheilung von Bosnien und der Hercegovina, with demographics according to the census collected on 16 June 1879.[11] The first thorough population census,[citation needed] it recorded 1,158,440 citizens of Bosnia and Herzegovina, by religion:
| Religion | Number |
|---|---|
Eastern Orthodox Christians
|
496,761 (42,88%) |
Muslims
|
448,613 (38.75%) |
| Roman Catholics | 209,391 (18.08%) |
| Jews | 3,426 |
| others | 249 |
1885 census
The Austro-Hungarian government published the Ortschafts-Bevölkerungs-Statistik von Bosnien und der Hercegovina nach dem Volkszählungs-Ergebnisse vom I. Mai 1885..[12] According to the 1885 population census there were 1,336,091 citizens of Bosnia and Herzegovina, by religion:
| Religion | Number |
|---|---|
| Eastern Orthodox | 571,250 (42.76%) |
| Muslims | 492,710 (36.88%) |
| Roman Catholics | 265,788 (19.89%) |
| others | 6,343 (0.47%) |
1895 census

An
The number of persons per square mile was the second lowest in
| Type | Number |
|---|---|
| Doljna Tuzla | 106 |
Banjaluka
|
96 |
| Bihać | 91 |
| Sarajevo | 73 |
| Mostar (Hercegovina) | 65 |
| Travnik | 62 |
There were 5,388 settlements, 11 of which had more than 5,000 inhabitants. Over 4,689 of those settlements contained less than 500 inhabitants.
The population census by religion:[citation needed]
| Type | Description |
|---|---|
Serbian Orthodox Christians
|
674,000 (43%) |
Muslims
|
550,000 (35%) |
| Catholics | 334,000 (21.3%) |
| Jews | 8,000 |
Protestants
|
4,000 |
The territorial distribution among the area didn't change much. The towns became more multiethnic.
1910 census

According to the 1910 population census there were 1,898,044 citizens of Bosnia and Herzegovina:
| Religion | Number |
|---|---|
| Eastern Orthodox | 825,918 (43.49%) |
| Muslims | 612,137 (32.25%) |
| Roman Catholics | 434,061 (22.87%) |
| others | 26,428 (1.39%) |
The urban population was, according to religion, 50.76% Muslims, 24.49% Roman Catholics, and 19.92% Eastern Orthodox. Land ownership was 91.1% Muslims, 6% Eastern Orthodox, 2.6% Roman Catholics, and 0.3% others. Comparing the 1910 percentages with the 1879 census shows a drop of the Muslim percentage from 39% to 32%, and a rise in Catholics from 18% to 23%, while the Orthodox population hovered around 43% the entire time.
World War I
The First World War left Bosnia and Herzegovina without a total figure of 360,000 citizens or 19% of its population.
Migrations
As soon as the State of Slovenes, Croats and Serbs was formed, a number of earlier colonized families started to emigrate and return to their homelands, among them Germans, Czechs, Poles, Slovaks, Hungarians and Ruthenians.
The new planned resettlement plans hit most the
The earlier emigrational tendency of the Muslim population towards Ottoman-held territories continued.
A great number of the population, among whom the
Kingdom of Yugoslavia
Territorial distribution
Following the
1921 census
The
- Serbs and Croats
- undecided and others (mostly Muslims)
By religion:
- Serbian Orthodox Christians 829,290 (43.87%)
- Sunni Muslims588,244 (31.07%)
- Catholic Christians444,308 (23.58%)
- others 28,595 (1.58%)
Sarajevo
The population of the district of Sarajevo according to the 1921
- Serbian Orthodox Christians 55,477 (38.6%%)
- Sunni Muslims50,270 (34.9%)
- Croats 29,395 (20.4%)
- others 8,768 (6.1%)
There were 8 municipalities and their populations were:
- Muslims comprised the majority in the City of Sarajevo and in 2 municipalities: Bjelašnica and Ozren
The same year the City of Sarajevo had 78,173 inhabitants:
- Sunni Muslims29,649 (37.9%)
- Catholics 21,373 (27.3%)
- Serbian Orthodox Christians 18,630 (23.8%)
- others 8,522 (11.0%)
1931 census
The Kingdom of Yugoslavia has conducted a population census on the territory of Bosnia and Herzegovina on 31 March 1931 which stated that there were 2,323,555 persons. The population was given several nationalities:
By religion:
| Name | Number | Percentage |
|---|---|---|
| Serbian Orthodox Christians | 1,028,139 | 44.25% |
Sunni Muslims
|
718,079 | 30.9% |
| Catholics | 547,949 | 23.58% |
| others | 29,388 | 1.27% |
World War II
Losses
The Federal Bureau of Statistics in Belgrade composed a figure of 179,173 persons killed in the war in
Expulsions and relocations
By the plans of
The Muslim population was also exposed to suffering and intense relocation, mainly to cities and mostly to
Socialist Yugoslavia
1945–1948 colonization of Vojvodina
Prior to the expulsions of Germans from Vojvodina in 1945–1948, a number of inhabitants of Bosnia and Herzegovina moved to the new living spaces in Vojvodina:
- Serbs around 70,000 (98%)
- Croats and Muslims (around 2%)
1948 census
According to the 1948 People's Federal Republic of Yugoslavia population census, the People's Republic of Bosnia and Herzegovina had 2,565,277 inhabitants:
- Serbs 1,136,116 (44.3%)
- undecided 788,403 (30.7%)[note 1]
- Croats 614,123 (23.9%)
- Slovenes 4,338 (0.2%)
- Montenegrins3,094 (0.1%)
- Macedonians 675
- others 18,528 (0.8%)
1953 census
According to the 1953 Yugoslav population census, Bosnia and Herzegovina had 2,847,790 inhabitants:
- Serbs 1,264,372 (44.4%)
- undecided 891,800 (31.3%)[note 1]
- Croats 654,229 (23%)
- Montenegrins 7,336 (0.3%)
- Slovenes 6,300 (0.2%)
- Macedonians 1,884 (0.1%)
- others 21,869 (0.7%)
1961 census
According to the 1961 Socialist Federal Republic of Yugoslavia population census, the Socialist Republic of Bosnia and Herzegovina had 3,277,948 inhabitants:
- Serbs 1,406,057 (42.9%)
- Muslims (later Bosniaks carried the name Muslims) 842,248 (25.7%)[note 2]
- Croats 711,665 (21.7%)
- Yugoslavs 275,883 (8.4%)
- Montenegrins 12,828 (0.4%)
- Rusyns 6,136 (0.2%)
- Slovenes 5,939 (0.2%)
- Albanians 3,642 (0.1%)
- Macedonians 2,391 (0.1%)
- Turks 1,812 (0.1%)
- Hungarians 1,415 (0.1%)
- others 6,849 (0.2%)
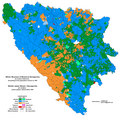
-
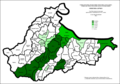
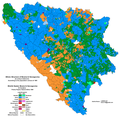
 Ethnic structure of Bosnia and Herzegovina by settlements 1961
 -
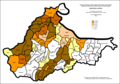
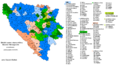 Ethnic structure of Bosnia and Herzegovina by municipalities 1961.
 -
 Ethnic structure of Bosnia and Herzegovina by municipalities 1961
 -
 Ethnic structure of Bosnia and Herzegovina by municipalities 1961
 -
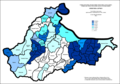
 Share of Muslims in Bosnia and Herzegovina by municipalities 1961
 -
 Share of Serbs in Bosnia and Herzegovina by municipalities 1961
 -
 Share of Croats in Bosnia and Herzegovina by municipalities 1961


Ethnic maps of Sarajevo and Brcko by settlements:
-
 Ethnic structure of Sarajevo by settlements 1961
 -
 Share of Serbs in Sarajevo by settlements 1961
 -
 Ethnic structure of Brcko by settlements 1961
 -
 Ethnic structure of Brcko by settlements 1961
 -
 Share of Croats in Brcko by settlements 1961
 -
 Share of Serbs in Brcko by settlements 1961
 -
 Share of Muslims in Brcko by settlements 1961


1971 census
According to the 1971 Socialist Federal Republic of Yugoslavia population census, the Socialist Republic of Bosnia and Herzegovina had 3,746,111 inhabitants:
- Muslims (later Bosniaks carried the name Muslims) 1,482,430 (39.6%)[note 3]
- Serbs 1,393,148 (37.2%)
- Croats 772,491 (20.6%)
- Yugoslavs 43,796 (1.2%)
- Montenegrins 13,021 (0.3%)
- Ukrainians 5,332 (0.2%)
- Slovenes 4,053 (0.2%)
- Albanians 3,764 (0.1%)
- Macedonians 1,773 (0.0%)
- Roma 1,456 (0.0%)
- Hungarians 1,262 (0.0%)
- others 23,584 (0,8%)
-
 Ethnic structure of Bosnia and Herzegovina by settlements 1971
 -
 Ethnic structure of Bosnia and Herzegovina by municipalities 1971
 -
 Ethnic structure of Bosnia and Herzegovina by municipalities 1971
 -
 Share of Muslims in Bosnia and Herzegovina by municipalities 1971
 -
 Share of Serbs in Bosnia and Herzegovina by municipalities 1971
 -
 Share of Croats in Bosnia and Herzegovina by municipalities 1971


Ethnic maps of Sarajevo and Brcko by settlements:
-
 Ethnic structure of Sarajevo by settlements 1971
 -
 Ethnic structure of Brcko by settlements 1971
 -
 Ethnic structure of Brcko by settlements 1971
 -
 Share of Muslims in Brcko by settlements 1971
 -
 Share of Croats in Brcko by settlements 1971
 -
 Share of Serbs in Brcko by settlements 1971


1981 census
According to the 1981 Socialist Federal Republic of Yugoslavia population census, the Socialist Republic of Bosnia and Herzegovina had 4,124.008 inhabitants:
- Muslims (later Bosniaks carried the name Muslims) 1,629,924 (39.5%)[note 4]
- Serbs 1,320,644 (32%)
- Croats 758,136 (18.4%)
- Yugoslavs 326,280 (7.9%)[note 4]
- Montenegrins 14,114 (0.3%)
- Roma 7,251 (0.2%)
- Ukrainians 4,502 (0.1%)
- Albanians 4,396 (0.1%)
- Slovenes 2,755 (0.1%)
- Macedonians 1,892 (0.1%)
- others 54,119 (1.4%)
During the time of
-
 Ethnic structure of Bosnia and Herzegovina by settlements 1981
 -
 Ethnic structure of Bosnia and Herzegovina by settlements 1981
 -
 Ethnic structure of Bosnia and Herzegovina by municipalities 1981
 -
 Ethnic structure of Bosnia and Herzegovina by municipalities 1981
 -
 Ethnic structure of Bosnia and Herzegovina by municipalities 1981
 -
 Share of Muslims in Bosnia and Herzegovina by municipalities 1981
 -
 Share of Serbs in Bosnia and Herzegovina by municipalities 1981
 -
 Share of Croats in Bosnia and Herzegovina by municipalities 1981


Ethnic maps of Sarajevo and Brcko by settlements:
-
 Ethnic structure of Sarajevo by settlements 1981
 -
 Ethnic structure of Brcko by settlements 1981
 -
 Ethnic structure of Brcko by settlements 1981
 -
 Share of Muslims in Brcko by settlements 1981
 -
 Share of Croats in Brcko by settlements 1981
 -
 Share of Serbs in Brcko by settlements 1981


The 1981 territorial population distribution in the Socialist Republic of Bosnia and Herzegovina:
- Serbs:
- majority in 2,439 settlements or 41.4% of the total settlements
- lived in 34.3% of the total housing
- Muslims
- majority in 2,179 settlements or 37%of the total settlements
- lived in 37.6% of the total housing
- Croats
- majority in 1,016 settlements or 17.3% of the total settlements
- lived in 17.3% of the total housing
- mixed and rest
- 223 settlements
During the time of Socialist Federal Republic of Yugoslavia, slight fall in population percentage and settlements of Croats in Bosnia and Herzegovina was due to immigration in foreign countries of western Europe, while Serbs colonized Vojvodina, Bosniaks stayed in Bosnia. Also as the data shows, Serbian people were less urbanized than Bosniaks or Croats and preferred smaller settlements (31% percent of populations lived in 41% of settlements).
1991 census
Yugoslav population census, Bosnia and Herzegovina had 4,377,053 inhabitants:
- ethnic Muslims 1,902,956 (43.47%)[note 5]
- Serbs 1,366,104 (31.21%)
- Croats 760,872 (17.38%)
- Yugoslavs 242,682 (5.54%)[note 5]
- others 104,439 (2.40%):
- Montenegrins – 10,071
- Roma– 8,864
- Albanians – 4,922
- Ukrainians – 3,929
- Slovenes – 2,190
- Macedonians – 1,596
- Hungarians – 893
- Italians – 732
- Czechs – 590
- Poles – 526
- Germans – 470
- Jews – 426
- Russians – 297
- Slovaks – 297
- Turks – 267
- Romanians – 162
- Ruthenians – 133
- Other nationalities – 17,592
- Undefined nationality – 14,585
- Regional defined – 224
- Unknown – 35,670
Ethnic maps by settlements:
-
 Ethnic structure of Bosnia and Herzegovina by settlements 1991
 -
 Ethnic structure of Bosnia and Herzegovina by settlements 1991
 -
 Ethnic structure of Bosnia and Herzegovina by settlements 1991
 -
 Share of Muslims in Bosnia and Herzegovina by settlements 1991
 -
 Share of Serbs in Bosnia and Herzegovina by settlements 1991
 -
 Share of Croats in Bosnia and Herzegovina by settlements 1991
 -
 Share of Yugoslavs in Bosnia and Herzegovina by settlements 1991


Ethnic maps by municipalities:
-
 Ethnic structure of Bosnia and Herzegovina by municipalities 1991
 -
 Ethnic structure of Bosnia and Herzegovina by municipalities 1991
 -
 Ethnic structure of Bosnia and Herzegovina by municipalities 1991
 -
 Share of Muslims in Bosnia and Herzegovina by municipalities 1991
 -
 Share of Serbs in Bosnia and Herzegovina by municipalities 1991
 -
 Share of Croats in Bosnia and Herzegovina by municipalities 1991


-
 Ethnic structure of Bosnia and Herzegovina by municipalities 1991 (territorial organization from 2013)
 -
 Ethnic structure of Bosnia and Herzegovina by municipalities 1991 (territorial organization from 2013)
 -
 Share of Muslims in Bosnia and Herzegovina by municipalities 1991 (territorial organization from 2013)
 -
 Share of Serbs in Bosnia and Herzegovina by municipalities 1991 (territorial organization from 2013)
 -
 Share of Croats in Bosnia and Herzegovina by municipalities 1991 (territorial organization from 2013)


Ethnic maps by Republic of Srpska by municipalities:
-
 Ethnic structure of Republic of Srpska by municipalities 1991 (territorial organization from 2013)
 -
 Ethnic structure of Republic of Srpska by municipalities 1991 (territorial organization from 2013)
 -
 Share of Serbs in Republic of Srpska by municipalities 1991 (territorial organization from 2013)
 -
 Share of Bosniaks in Republic of Srpska by municipalities 1991 (territorial organization from 2013)
 -
 Share of Croats in Republic of Srpska by municipalities 1991 (territorial organization from 2013)


Ethnic maps of Sarajevo by settlements:
-
 Ethnic structure of Sarajevo by settlements 1991
 -
 Ethnic structure of Sarajevo by settlements 1991
 -
 Share of Muslims in Sarajevo by settlements 1991
 -
 Share of Serbs in Sarajevo by settlements 1991
 -
 Share of Croats in Sarajevo by settlements 1991


Ethnic maps of Brcko by settlements:
-
 Ethnic structure of Brcko by settlements 1991
 -
 Ethnic structure of Brcko by settlements 1991
 -
 Share of Muslims in Brcko by settlements 1991
 -
 Share of Croats in Brcko by settlements 1991
 -
 Share of Serbs in Brcko by settlements 1991


Modern
1992 estimate
4.4 million people of which:
Bosnian War
During the Bosnian War (1992–1995) ethnic cleansing drastically changed the ethnic composition and population distribution in Bosnia and Herzegovina. (See: Casualties of the Bosnian War)
1996 UNHCR census
In 1996 the UNHCR conducted a detailed population census in the whole country. This census was not only officially considered "official" because the Government of BH refused to recognize it, claiming that its recognition would be the same as the recognition of the ethnic cleansing conducted in the war. It was concluded that Bosnia and Herzegovina had 3,919,953 inhabitants:[citation needed]
| Type | Number | Percentage |
|---|---|---|
| Bosniaks | 1,805,910 | 46.07% |
| Serbs | 1,484,530 | 37.88% |
| Croats | 571,317 | 14.58% |
| others | 58,196 | 1.47% |
Federation
Totally 2,444,665 [citation needed]
| Type | Number | Percentage |
|---|---|---|
| Bosniaks | 1,773,566 | 72.5% |
| Croats | 556,289 | 22.8% |
| Serbs | 56,618 | 2.3% |
| others | 58,192 | 2.4% |
Republika Srpska
Totally 1,475,288 [citation needed]
| Type | Percentage Range |
|---|---|
| Serbs | 1,427,912 (96.8%) |
| Bosniaks | 32,344 (2.2%) |
| Croats | 15,028 (1%) |
| others | 4 |
Ethnic (2000 estimate)
| Type | Percentage Range |
|---|---|
| Bosniaks | 46% (of whom around 95% are followers of Islam) |
| Serbs | 37.8% (of whom around 99% are followers of the Serbian Orthodox Church) |
| Croats | 14.7% (of whom around 88% are followers of the Catholic Church) |
| others | 0.6% |
2002-2005 population estimates
3,922,205 (2002)
4,025,476 (July 2005 estimate)
Religious (2008 estimate)
| Type | Percentage Range[15] |
|---|---|
| Muslims | 45% |
| Eastern Orthodox Serbs | 36% |
| Roman Catholics | 15% |
| other | 4% |
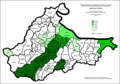
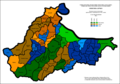
2013 census
In October 2013, Bosnia conducted its first official census since the Bosnian War.[16]
-
 Population density in Bosnia and Herzegovina by municipality, early data from the 2013 census
The Agency for Statistics of Bosnia and Herzegovina announced the final census results on July 1, 2016, based on methodology that is disputed by the Republic of Srpska entity, and because of this, doesn't recognize these results as relevant. The European Union welcomed the results of the census and evaluated them as correct and in accordance to EU statistical standards.[17]
Total population: 3,531,159
Ethnic structure
| Population | Percentage of total population | |
|---|---|---|
| Bosniaks | 1,769,592 | 50.11% |
| Serbs | 1,086,733 | 30.78% |
| Croats | 544,780 | 15.43% |
| Others | 96,539 | 2.73% |
| Not declared | 27,055 | 0.71% |
| No answer | 6,460 | 0.18% |
-
 Ethnic structure of Bosnia and Herzegovina by municipalities 2013
 -
 Ethnic structure of Bosnia and Herzegovina by municipalities 2013
 -
 Share of Bosniaks in Bosnia and Herzegovina by municipalities 2013
 -
 Share of Serbs in Bosnia and Herzegovina by municipalities 2013
 -
 Share of Croats in Bosnia and Herzegovina by municipalities 2013


Ethnic maps of Republika Srpska by municipalities:
-
 Ethnic structure of Republika Srpska by municipalities 2013
 -
 Ethnic structure of Republika Srpska by municipalities 2013
 -
 Share of Serbs in Republika Srpska by municipalities 2013
 -
 Share of Bosniaks in Republika Srpska by municipalities 2013
 -
 Share of Croats in Republika Srpska by municipalities 2013


Ethnic maps of Sarajevo by settlements:
-
 Ethnic structure of Sarajevo by settlements 2013
 -
 Ethnic structure of Sarajevo by settlements 2013
 -
 Share of Bosniaks in Sarajevo by settlements 2013
 -
 Share of Serbs in Sarajevo by settlements 2013
 -
 Share of Croats in Sarajevo by settlements 2013


Ethnic maps of Brcko by settlements:
-
 Ethnic structure of Brcko by settlements 2013
 -
 Ethnic structure of Brcko by settlements 2013
 -
 Share of Bosniaks in Brcko by settlements 2013
 -
 Share of Serbs in Brcko by settlements 2013
 -
 Share of Croats in Brcko by settlements 2013


Linguistic structure
-
 Linguistic structure of Bosnia and Herzegovina by municipalities 2013
 -
 Linguistic structure of Bosnia and Herzegovina by municipalities 2013
 -
 Share of Bosnian language in Bosnia and Herzegovina by municipalities 2013
 -
 Share of Serbian language in Bosnia and Herzegovina by municipalities 2013
 -
 Share of Croatian language in Bosnia and Herzegovina by municipalities 2013


Linguistic maps of Republika Srpska by municipalities:
-
 Linguistic structure of Republika Srpska by municipalities 2013
 -
 Linguistic structure of Republika Srpska by municipalities 2013
 -
 Share of Serbian language in Republika Srpska by municipalities 2013
 -
 Share of Bosnian language in Republika Srpska by municipalities 2013
 -
 Share of Croatian language in Republika Srpska by municipalities 2013


Religious structure
- Islam: 1,790,454 (50.7%)
- Orthodoxy: 1,085,760 (30.7%)
- Catholicism: 536,333 (15.2%)
- others: 118,612 (3.4%)
-
 Religious structure of Bosnia and Herzegovina by municipalities 2013
 -
 Religious structure of Bosnia and Herzegovina by municipalities 2013
 -
 Share of Muslims in Bosnia and Herzegovina by municipalities 2013
 -
 Share of Orthodox in Bosnia and Herzegovina by municipalities 2013
 -
 Share of Catholics in Bosnia and Herzegovina by municipalities 2013


Religious maps of Republika Srpska by municipalities:
-
 Religious structure of Republika Srpska by municipalities 2013
 -
 Religious structure of Republika Srpska by municipalities 2013
 -
 Share of Orthodox in Republika Srpska by municipalities 2013
 -
 Share of Muslims in Republika Srpska by municipalities 2013
 -
 Share of Catholics in Republika Srpska by municipalities 2013


See also
- Bosnia and Herzegovina
- Federation of Bosnia and Herzegovina
- Republika Srpska
- Brčko District
- Herzeg-Bosnia
- History of Bosnia and Herzegovina
- Bosniaks
- Bosnians
- Croats
- Serbs
- History of the Jews in Bosnia and Herzegovina
- Muslims (ethnic group)
- 1991 Bosnia and Herzegovina Population Census
Notes
- ^ a b In 1948 and 1953 census the Bosniaks (Bosnian Muslims) were not recognized as a nationality by constitution nor the Yugoslav census format, so there was no formal label for the Bosnian Muslims as they would prefer at the time, so vast majority of them instead declared as either ethnically undecided/undeclared, or as "Serb", "Croat", "Yugoslav".
- ^ In 1961 census, Bosnian Muslims (i.e. the Bosniaks) were still not recognized as a nationality by constitution nor the census format, however in the 1961 census some 800,000 Bosnian Muslims declared themselves "ethnically undecided", and some were still using their other options and declared as "Serb", "Croat", "Yugoslav". Because of the large Muslim community in Bosnia, subsequently the census commission concluded to informally group them under the label "muslims in a national sense", using lower case "m" (grammatically appropriate for Serbo-Croatian), which will change into upper case "M" in the next 1971 census with formalization of the nationhood and national label "Muslim".
- endonym: Muslimani), leading to a drop in the percentage of other populations, especially significant in case of "Yugoslavs". Although the Bosnian leadership opted for the label "Bosnian", this was rejected by the central government in favor of "Muslim", which became the official.
- ^ a b In 1981 census, following the death of Josip Broz Tito in 1980, there was again surge in percentage of Yugoslavs as an expression of Yugoslavian patriotism, phenomenon that was particularly evident in Bosnian Muslim population, who were choosing "Yugoslav" over "Serb", "Croat" or "Muslim".
- ^ a b In 1991 census, percentage of Yugoslavs dropped again, while marginally higher rise in percentage of Bosnian Muslim population was recorded, which was a consequence of looming break up of Yugoslavia and Yugoslav identity is soon to be abandoned altogether. Following the 1991 census, Bosnian-Herzegovinian government in constitutional amendment of 1993 reintroduced the name "Bosniak" to replace the label "Muslim", since the Yugoslav policy was considered to neglecting the Bosniak's Bosnian identity (see Hamdija Pozderac), and Yugoslavia ceased to exist.
- ^ In 1992 estimate, with Yugoslavia gone, Bosnian-Herzegovinian government in constitutional amendment of 1993 reintroduced the name "Bosniak" to replace the label "Muslim".
References
- ^ "Stanovništvo Bosne i Hercegovine po popisima 1879–1991" [Population of Bosnia and Herzegovina according to censuses 1879–1991] (in Bosnian). Institute for Statistics of Federation of Bosnia and Herzegovina. Archived from the original on 19 September 2013. Retrieved 7 September 2013.
- ^ http://www.draganprimorac.com/wp-content/uploads/2010/05/Battaglia.pdf [bare URL PDF]
- ^ "Povijet – istorija Bosne i Hercegovine". www.bosna-hercegovina.info. Retrieved 8 April 2019.
- ISBN 978-0-330-41244-5.
- Faculty of Philosophy (2007-10-02). "Posavska krajina/granica od 1718. do 1739. godine – The Sava military borderland, 1718 – 1739" (in Croatian). University of Zagreb. Retrieved 2010-06-29.
- ISSN 0584-9888. Archived from the originalon 18 April 2019. Retrieved 6 May 2020.
Critobulus has extremely negative opinion of the Latins, while for other nations as to the Romeji, Serbs, Hungarians, and inhabitants of Bosnia – except Albanians and Vlachs for whom he has some hostilities – has a certain sympathy.
- ISSN 0584-9888. Archived from the originalon 18 April 2019. Retrieved 6 May 2020.
Encouraged by all these benefits, Vostri never intend to comply to the Sultan or make contracts and pay him annual tribute, as did other neighbors Illyrians (as author called Albanians) and Tribals (as author called Serbs), nor to subordinate themselves to him in any way.
- ^ Radivoj Radić (2006). "Bosnia in the work of Kritoboulos of Imbros" (in Serbo-Croatian). scindeks.nb.rs. pp. 140–154. Archived from the original on 18 July 2012. Retrieved 6 May 2020.
- ISBN 978-1-60344-724-9.
- ^ a b "Sarajevo, famous for gunshot that led to WWI, now a city of harmony". The Denver Post. The Associated Press. 19 June 2014. Retrieved 7 May 2020.
- ^ "Haupt-Uebersicht der politischen Eintheilung von Bosnien und der Hercegovina" (PDF). 1880 [1879].
- ^ "Ortschafts-Bevölkerungs-Statistik von Bosnien und der Hercegovina nach dem Volkszählungs-Ergebnisse vom I. Mai 1885" (PDF). Sarajevo: Landesdrackerei. 1886 [1885].
- ^ a b Klaar, Karl (1907). "Bosnia and Herzegovina". New Advent Catholic Encyclopedia. New York: Robert Appleton Company.
- ^ "An International Symposium "Southeastern Europe 1918-1995"". Archived from the original on 2006-08-22. Retrieved 2006-01-02.
- ^ International Religious Freedom Report 2008 – Bosnia and Herzegovina
- ^ Jukic, Elvira (2013-08-30). "Bosnia Statistics Agency Readies for October Census". Retrieved 2013-09-20.
- ^ "The EU welcomes the results of the 2013 Bosnian census". N1 Info (CNN affiliate). Retrieved 28 July 2016.
External links
- 1991 Census in BIH – census data for all municipalities
- 1991 Census in BIH – census data for settlements
- Census data
- Serbs of SFRJ
- The Serbs of Bosnia and Herzegovina
- Bosnia and Herzegovina in the Catholic Encyclopedia
- The historical aspect of the Serbian question in the Yugoslav crisis
- Agrarian reform of 1918 Archived 2006-08-22 at the Wayback Machine
- Population of Bosnia and Herzegovina (in Croatian and Bosnian)
- CIA World Fact book – Bosnia and Herzegovina
- Short documentary on Displaced people and refugees in Bosnia and Herzegovina
Bosnia and Herzegovina topics | ||
|---|---|---|
| History |
|  |
| Geography | ||
| Governance | ||
| Economy |
| |
| Society |
| |
| Culture |
| |