
Guadalupe Peak
| Guadalupe Peak | |
|---|---|
State high point 14th | |
| Coordinates | 31°53′29″N 104°51′39″W / 31.891460742°N 104.860710292°W[1] |
| Geography | |
 Guadalupe Peak Location of Guadalupe Peak in Texas | |
| Location | Culberson County, Texas, U.S. |
| Parent range | Guadalupe Mountains |
| Topo map | USGS Guadalupe Peak |
Guadalupe Peak, also known as Signal Peak,
Trail and summit
The peak can be climbed at any time of the year by a maintained stony trail (4.25 miles or 6.8 kilometers each way) with a 3,000-foot (910 m) elevation gain.
A stainless steel pyramid marks the summit. It was erected by

A hiker was found dead on New Year's Eve 2022, as there were wind gusts of more than 50 miles (80 km) per hour and wind chills were "well below freezing".[6][7][8]
"At nearly 9,000 feet (2,700 m) above sea level, Guadalupe Peak is a mountain environment with associated risks not found elsewhere in Texas," the park said, noting that the hike is a "very strenuous, 8.4-mile (13.5 km) round trip hike with a 3,000-foot (910 m) elevation gain" to the highest point in the state.
Climate
Guadalupe Peak has a
| Climate data for Guadalupe Peak 31.8933 N, 104.8575 W, Elevation: 8,189 ft (2,496 m) (1991–2020 normals) | |||||||||||||
|---|---|---|---|---|---|---|---|---|---|---|---|---|---|
| Month | Jan | Feb | Mar | Apr | May | Jun | Jul | Aug | Sep | Oct | Nov | Dec | Year |
| Mean daily maximum °F (°C) | 45.0 (7.2) |
46.8 (8.2) |
52.3 (11.3) |
58.7 (14.8) |
66.8 (19.3) |
75.3 (24.1) |
73.9 (23.3) |
72.2 (22.3) |
67.4 (19.7) |
61.1 (16.2) |
52.7 (11.5) |
45.6 (7.6) |
59.8 (15.5) |
| Daily mean °F (°C) | 36.2 (2.3) |
37.4 (3.0) |
42.5 (5.8) |
48.6 (9.2) |
57.0 (13.9) |
64.9 (18.3) |
64.5 (18.1) |
63.5 (17.5) |
58.7 (14.8) |
52.0 (11.1) |
43.4 (6.3) |
36.8 (2.7) |
50.5 (10.2) |
| Mean daily minimum °F (°C) | 27.4 (−2.6) |
28.1 (−2.2) |
32.7 (0.4) |
38.5 (3.6) |
47.2 (8.4) |
54.4 (12.4) |
55.1 (12.8) |
54.8 (12.7) |
50.0 (10.0) |
42.9 (6.1) |
34.2 (1.2) |
28.0 (−2.2) |
41.1 (5.1) |
| Average precipitation inches (mm) | 0.66 (17) |
0.84 (21) |
0.71 (18) |
0.43 (11) |
1.10 (28) |
1.79 (45) |
4.21 (107) |
4.23 (107) |
3.48 (88) |
1.56 (40) |
1.12 (28) |
0.96 (24) |
21.09 (534) |
| Source: PRISM Climate Group[9] | |||||||||||||
Gallery
-
 View west from top of peak.
 -
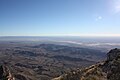
 Salt Flats from summit.
 -
 Guadalupe Mountains in sunset.
 -
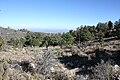
 Hiking trail up the peak.
 -
 High elevation (8,100 feet (2,500 m)) campground near summit.
 -
 Culberson County, Texas, from the summit.
 -
 The pyramid at the summit.


See also
- List of mountain peaks of North America
- List of mountain peaks of the United States
- List of U.S. states by elevation
- List of mountain peaks of the United States
References
- ^ a b c "El Capitan". NGS Data Sheet. National Geodetic Survey, National Oceanic and Atmospheric Administration, United States Department of Commerce. Retrieved 2001-05-24.
- ^ "Guadalupe Peak, Texas". Peakbagger.com. Retrieved 2001-05-24.
- Handbook of Texas Online. Texas State Historical Association. 15 June 2010. Retrieved 7 April 2015.
- ^ "Elevations and Distances in the United States". United States Geological Survey. April 29, 2005. Archived from the original on January 16, 2008. Retrieved 2009-03-28.
- ^ "Guadalupe Mountains: Guadalupe Peak Hike" (PDF). National Park Service. Retrieved 12 May 2015.
- ^ "Hiker found dead on Guadalupe Mountains trail that leads to highest peak in Texas".
- ^ "A hiker was found dead on Texas' Guadalupe Peak".
- ^ "One hiker died, another rescued from El Capitan Peak in Guadalupe Mountains".
- ^ "PRISM Climate Group, Oregon State University". PRISM Climate Group, Oregon State University. Retrieved December 11, 2023.
To find the table data on the PRISM website, start by clicking Coordinates (under Location); copy Latitude and Longitude figures from top of table; click Zoom to location; click Precipitation, Minimum temp, Mean temp, Maximum temp; click 30-year normals, 1991-2020; click 800m; click Retrieve Time Series button.
External links
 Definitions from Wiktionary
 Media from Commons
 News from Wikinews
 Quotations from Wikiquote
 Texts from Wikisource
 Textbooks from Wikibooks
 Resources from Wikiversity
- "Guadalupe Mountains National Park". National Park Service. Retrieved 2011-05-21.
- "Guadalupe Peak". Geographic Names Information System. United States Geological Survey, United States Department of the Interior. Retrieved 2001-05-24.
- "Guadalupe Peak". SummitPost.org. Retrieved 2011-05-21.
- "Guadalupe Peak Trip Report". High-Powered Planet. Retrieved 2011-11-14.