
1994 Swedish general election
| ||||||||||||||||||||||||||||||||||||||||||||||||||||||||||||||||||||||||||||||||||||||||||||||||||||||||||||
All 349 seats in the Riksdag 175 seats needed for a majority | ||||||||||||||||||||||||||||||||||||||||||||||||||||||||||||||||||||||||||||||||||||||||||||||||||||||||||||
|---|---|---|---|---|---|---|---|---|---|---|---|---|---|---|---|---|---|---|---|---|---|---|---|---|---|---|---|---|---|---|---|---|---|---|---|---|---|---|---|---|---|---|---|---|---|---|---|---|---|---|---|---|---|---|---|---|---|---|---|---|---|---|---|---|---|---|---|---|---|---|---|---|---|---|---|---|---|---|---|---|---|---|---|---|---|---|---|---|---|---|---|---|---|---|---|---|---|---|---|---|---|---|---|---|---|---|---|---|
| ||||||||||||||||||||||||||||||||||||||||||||||||||||||||||||||||||||||||||||||||||||||||||||||||||||||||||||
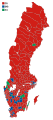
 Map of the election, showing the distribution of constituency and levelling seats, as well as the largest political bloc within each constituency. | ||||||||||||||||||||||||||||||||||||||||||||||||||||||||||||||||||||||||||||||||||||||||||||||||||||||||||||
| ||||||||||||||||||||||||||||||||||||||||||||||||||||||||||||||||||||||||||||||||||||||||||||||||||||||||||||


General elections were held in Sweden on 18 September 1994.[1] The Swedish Social Democratic Party remained the largest party in the Riksdag, winning 161 of the 349 seats.[2] Led by Ingvar Carlsson, the party returned to power and formed a minority government after the election. This was the final time the Social Democrats recorded above 40% of the vote before the party's vote share steeply declined four years later and never recovered. The Greens also returned to the Riksdag after a three-year absence.
The election saw the largest bloc differences for a generation, with the red-green parties making sizeable inroads into the blue heartlands of inner Småland and Western Götaland, at an even higher rate than 1988. The Social Democrats gathered more than 50% of the vote in all five northern counties, Blekinge, Södermanland, Västmanland and Örebro.[3]
In spite of the loss of power, the
The Christian Democrats fared poorly, merely beating the threshold by 3,752 votes.[3] New Democracy, a right-wing populist political party which had entered the Riksdag three years earlier, performed poorly, losing most of its voters and all of its seats in the Riksdag. In total the party's vote share dropped from 6.7% in 1991 to 1.2% in 1994. The election introduced an extended electoral cycle of four years, replacing the previous three-year terms.
The proportion of women elected to the Riksdag increased from 34% in 1991 to 40%,[4][5] following a campaign by the Stödstrumporna (lit. 'The Support stockings') before the elections.[6]
They were the first elections in the world in which the official results were published live on the nascent internet.[7]
Debates
| 1994 Swedish general election debates | ||||||||||||
|---|---|---|---|---|---|---|---|---|---|---|---|---|
| Date | Time | Organizers | Moderators | P Present I Invitee N Non-invitee | ||||||||
| S | M | L | C | KD | NyD | V | MP | Refs | ||||
| Sveriges Television | Pia Brandelius [sv] | P Ingvar Carlsson |
P Carl Bildt |
P Bengt Westerber |
P Olof Johansson |
P Alf Svensson |
P Vivianne Franzén |
P Gudrun Schyman |
P Birger Schlaug |
[8] | ||
Results
 | |||||
|---|---|---|---|---|---|
| Party | Votes | % | Seats | +/– | |
| Swedish Social Democratic Party | 2,513,905 | 45.25 | 161 | +23 | |
| Moderate Party | 1,243,253 | 22.38 | 80 | 0 | |
| Centre Party | 425,153 | 7.65 | 27 | –4 | |
| Liberal People's Party | 399,556 | 7.19 | 26 | –7 | |
| Left Party | 342,988 | 6.17 | 22 | +6 | |
| Green Party | 279,042 | 5.02 | 18 | +18 | |
| Christian Democratic Society Party | 225,974 | 4.07 | 15 | –11 | |
| New Democracy | 68,663 | 1.24 | 0 | –25 | |
| Other parties | 57,006 | 1.03 | 0 | 0 | |
| Total | 5,555,540 | 100.00 | 349 | 0 | |
| Valid votes | 5,555,540 | 98.50 | |||
| Invalid/blank votes | 84,853 | 1.50 | |||
| Total votes | 5,640,393 | 100.00 | |||
| Registered voters/turnout | 6,496,120 | 86.83 | |||
| Source: Nohlen & Stöver | |||||
Seat distribution
| Constituency | Total seats |
Seats won | ||||||||||
|---|---|---|---|---|---|---|---|---|---|---|---|---|
| By party | By coalition | |||||||||||
| S | M | C | F | V | MP | KDS | Left | Right | Others | |||
Älvsborg North
|
12 | 5 | 2 | 1 | 1 | 1 | 1 | 1 | 6 | 5 | 1 | |
Älvsborg South
|
6 | 3 | 2 | 1 | 3 | 3 | ||||||
| Blekinge | 6 | 4 | 2 | 4 | 2 | |||||||
Bohus
|
13 | 5 | 3 | 1 | 1 | 1 | 1 | 1 | 6 | 6 | 1 | |
| Gävleborg | 12 | 6 | 2 | 1 | 1 | 1 | 1 | 7 | 4 | 1 | ||
| Gothenburg | 17 | 7 | 4 | 2 | 2 | 1 | 1 | 9 | 7 | 1 | ||
| Gotland | 2 | 2 | 2 | |||||||||
| Halland | 9 | 4 | 3 | 1 | 1 | 4 | 5 | |||||
| Jämtland | 5 | 3 | 1 | 1 | 3 | 2 | ||||||
| Jönköping | 14 | 5 | 3 | 1 | 1 | 1 | 1 | 2 | 6 | 7 | 1 | |
| Kalmar | 11 | 5 | 2 | 2 | 1 | 1 | 6 | 5 | ||||
Kopparberg
|
13 | 6 | 2 | 1 | 1 | 1 | 1 | 1 | 7 | 5 | 1 | |
| Kristianstad | 12 | 6 | 3 | 1 | 1 | 1 | 6 | 6 | ||||
| Kronoberg | 6 | 3 | 2 | 1 | 3 | 3 | ||||||
| Malmö | 8 | 5 | 3 | 5 | 3 | |||||||
| Malmöhus North | 10 | 5 | 3 | 1 | 1 | 5 | 5 | |||||
| Malmöhus South | 12 | 5 | 4 | 1 | 1 | 1 | 5 | 6 | 1 | |||
| Norrbotten | 11 | 8 | 1 | 1 | 1 | 9 | 2 | |||||
| Örebro | 13 | 6 | 2 | 1 | 1 | 1 | 1 | 1 | 7 | 5 | 1 | |
| Östergötland | 15 | 7 | 3 | 1 | 1 | 1 | 1 | 1 | 8 | 6 | 1 | |
Skaraborg
|
12 | 5 | 2 | 1 | 1 | 1 | 1 | 1 | 6 | 5 | 1 | |
| Södermanland | 11 | 5 | 2 | 1 | 1 | 1 | 1 | 6 | 4 | 1 | ||
| Stockholm County | 36 | 14 | 11 | 2 | 3 | 2 | 2 | 2 | 16 | 18 | 2 | |
| Stockholm Municipality | 26 | 9 | 8 | 1 | 3 | 2 | 2 | 1 | 11 | 13 | 2 | |
| Uppsala | 12 | 5 | 3 | 1 | 1 | 1 | 1 | 6 | 5 | 1 | ||
Värmland
|
11 | 6 | 2 | 1 | 1 | 1 | 7 | 4 | ||||
| Västerbotten | 11 | 5 | 1 | 1 | 1 | 1 | 1 | 1 | 6 | 4 | 1 | |
| Västernorrland | 12 | 6 | 2 | 1 | 1 | 1 | 1 | 7 | 4 | 1 | ||
| Västmanland | 11 | 6 | 2 | 1 | 1 | 1 | 7 | 4 | ||||
| Total | 349 | 161 | 80 | 27 | 26 | 22 | 18 | 15 | 183 | 148 | 18 | |
| Source: Statistics Sweden | ||||||||||||
By municipality
-
 Votes by municipality. The municipalities are the color of the party that got the most votes within the coalition that won relative majority.
 -
 Cartogram of the map to the left with each municipality rescaled to the number of valid votes cast.
 -
 Map showing the voting shifts from the 1991 to the 1994 election. Darker blue indicates a municipality voted more towards the parties that formed the centre-right bloc. Darker red indicates a municipality voted more towards the parties that form the left-wing bloc.
 -
 Votes by municipality as a scale from red/Left-wing bloc to blue/Centre-right bloc.
 -
 Cartogram of vote with each municipality rescaled in proportion to number of valid votes cast. Deeper blue represents a relative majority for the centre-right coalition, brighter red represents a relative majority for the left-wing coalition.


References
- ISBN 978-3-8329-5609-7
- ^ Nohlen & Stöver, p1873
- ^ Statistical Central Bureau. Retrieved 18 November 2019.
- ^ "Elections held in 1991". Inter-Parliamentary Union.
- ^ "Elections held in 1994". Inter-Parliamentary Union.
- ^ Törnqvist, Maria (2019). ”Varannan damernas eller hela makten? Kommentar till Maria-Pia Boëthius, "Krav på kvinnoparti"”. i Klara Arnberg, Fia Sundevall, David Tjeder. Könspolitiska nyckeltexter. Från Det går an till #metoo. p. 422–426
- ^ General aspects of Sweden's electoral system Election Resources
- ^ Sweden, Sveriges Television AB, Stockholm, Slutdebatter – Val-94: Slutdebatt (in Swedish), retrieved 2024-02-01
{{citation}}: CS1 maint: multiple names: authors list (link)
| General elections | |
|---|---|
| Local elections | |
| European elections | |
| Referendums | |