
Tourism in Brazil

Tourism is a growing sector and key to the economy of several regions of
Brazil offers for both domestic and international tourists an ample range of options, with natural areas being its most popular tourism product, a combination of
In terms of the 2015 Travel and Tourism Competitiveness Index (TTCI), which is a measurement of the factors that make it attractive to develop business in the travel and tourism industry of individual countries, Brazil ranked in the 28th place at the world's level, third in the Americas, after Canada and United States.[5][6] Brazil main competitive advantages are its natural resources, which ranked 1st on this criterion out of all countries considered, and ranked 23rd for its cultural resources, due to its many World Heritage Sites. The 2013 TTCI report also notes Brazil's main weaknesses: its ground transport infrastructure remains underdeveloped (ranked 129th), with the quality of roads ranking in the 121st place, and quality of air transport infrastructure in 131st; and the country continues to suffer from a lack of price competitiveness (ranked 126th), due in part to high and increasing ticket taxes and airport charges, as well as high and rising prices more generally. Safety and security improved significantly between 2008 and 2013, moving from 128th to 73rd place,[6] before slipping to 106th by 2017.[7]
Foreign tourists mainly come from Argentina, Uruguay, Paraguay, Bolivia, Peru, Ecuador, Colombia, Venezuela, Costa Rica, Mexico, Cuba, the Dominican Republic, the United States, Canada, China, South Korea, Japan, Australia, Chile, Spain, Italy, France, Germany, the United Kingdom, Greece, Ireland, the Netherlands, Belgium, Switzerland, Portugal, and Russia.
International tourism
| Historical international tourism arrivals 1995-2019 | ||||
|---|---|---|---|---|
| Year | International tourist arrivals (x1000) |
Annual growth (%) |
Total revenue (millions USD )
|
Annual growth (%) |
| 1995[8][9] | 1,991 | - | 972 | - |
| 2000[8][9] | 5,313 | - | 1,810 | - |
| 2003[8][9] | 4,133 | - | 2,479 | - |
| 2004[8][9] | 4,794 | 16.0 | 3,222 | 30.0 |
| 2005[10] | 5,358 | 11.8 | 3,861 | 19.8 |
| 2006[10] | 5,019 | -6.3 | 4,316 | 1.1 |
| 2007[11][12] | 5,025 | 0.1 | 4,953 | 14.8 |
| 2008[13][14] | 5,050 | 0.5 | 5,780 | 16.7 |
| 2009[15] | 4,802 | -4.9 | 5,305 | -8.2 |
| 2010[3][16] | 5,161 | 7.5 | 5,702 | 7.5 |
| 2011[3] | 5,433 | 5.3 | 6,555 | 14.9 |
| 2012[3] | 5,677 | 4.5 | 6,645 | 1.3 |
| 2013[17] | 5,813 | 2.4 | 6,704 | 0.9 |
| 2014 | 6,430 | n/a | n/a | n/a |
| 2015 | 6,306 | n/a | n/a | n/a |
| 2016[18] | 6,578 | n/a | n/a | n/a |
| 2017[18] | 6,589 | 0.6 | 5,809 | n/a |
| 2018[19] | 6,621 | 0.5 | 5,921 | n/a |
| 2019[19] | 6,353 | -4.4 | 5,995 | n/a |
According to the
Despite continuing record breaking of international tourism revenues, the number of Brazilian tourists travelling overseas has been growing steadily since 2003, resulting in a net negative foreign exchange balance, as more money is spent abroad by Brazilian than receipts from international tourist visiting Brazil. Tourism expenditures abroad grew from USD 5.76 billion in 2006, to USD 8.21 billion in 2007, a 42,45% increase, representing a net deficit of USD 3.26 billion in 2007, as compared to USD 1.45 billion in 2006, a 125% increase from the previous year.[23] This trend is caused by Brazilians taking advantage of the stronger Real to travel and making relatively cheaper expenditures abroad.[23] Brazilian traveling overseas in 2006 represented 3.9% of the country's population.[24]
In 2005, tourism contributed with 3.2% of the country's revenues from exports of goods and services, and represented 7% of direct and indirect employment in the Brazilian economy.
In 2005, Rio de Janeiro, Foz do Iguaçu, São Paulo, Florianópolis, and Salvador were the most visited cities by international tourists for leisure trips. The most popular destinations for business trips were São Paulo, Rio de Janeiro, and Porto Alegre.[29] In 2006, Rio de Janeiro and Fortaleza were the most popular destinations by national visitors.[30]
| Main destinations visited by international leisure tourists in 2019[4] Top 10 ranking by number of visitors | |||||||
|---|---|---|---|---|---|---|---|
| Ranking (2019) |
Destination | State | |||||
| 1st | Rio de Janeiro | RJ | |||||
| 2nd | Florianópolis | SC | |||||
| 3rd | Foz do Iguaçu | PR | |||||
| 4th | São Paulo | SP | |||||
| 5th | Armação dos Búzios | RJ | |||||
| 6th | Salvador | BA | |||||
| 7th | Bombinhas | SC | |||||
| 8th | Angra dos Reis | RJ | |||||
| 9th | Balneário Camboriú | SC | |||||
| 10th | Paraty | RJ | |||||
| Main destinations visited by national leisure tourists in 2020[31] Top 10 ranking by number of visitors | |||||||
|---|---|---|---|---|---|---|---|
| Ranking (2020) |
Destination | State | |||||
| 1st | Rio de Janeiro | RJ | |||||
| 2nd | São Paulo | SP | |||||
| 3rd | Maceió | AL | |||||
| 4th | Gramado | RS | |||||
| 5th | Fortaleza | CE | |||||
| 6th | Natal | RN | |||||
| 7th | Foz do Iguaçu | PR | |||||
| 8th | Porto de Galinhas | PE | |||||
| 9th | Salvador | BA | |||||
| 10th | Florianópolis | SC | |||||
Arrivals by country of origin
| Top 20 visitor arrivals to Brazil by country of origin in 2016 - 2020 | |||||||||
|---|---|---|---|---|---|---|---|---|---|
| Ranking 2020 |
Country of origin |
Visitor arrivals 2020[32] |
Visitor arrivals 2016[33] |
% Total increase/decrease |
Ranking 2020 |
Country of origin |
Visitor arrivals 2020[32] |
Visitor arrivals 2016[33] |
% Total increase/decrease |
| 1 | 887,805 | 2,294,900 | 11 | 45,449 | 138,106 | ||||
| 2 | 172,105 | 570,350 | 12 | 33,895 | 147,846 | ||||
| 3 | 131,174 | 311,813 | 13 | 32,665 | 114,276 | ||||
| 4 | 122,981 | 316,714 | 14 | 27,129 | 135,192 | ||||
| 5 | 113,714 | 284,113 | 15 | 26,950 | 70,103 | ||||
| 6 | 70,369 | 263,774 | 16 | 20,476 | 79,754 | ||||
| 7 | 61,149 | 221,513 | 17 | 18,195 | 34,962 | ||||
| 8 | 51,028 | 149,968 | 18 | 18,068 | 94,609 | ||||
| 9 | 48,595 | 202,671 | 19 | 17,932 | 49,809 | ||||
| 10 | 45,646 | 181,493 | 20 | 17,063 | 69,074 | ||||
| Visitor arrivals by region of origin in 2020 (Top 4)[32] | |||||||||
| 1 | South America | 1,383,550 | 3,732,722 | 3 | North America | 217,123 | 735,062 | ||
| 2 | Europe | 430,166 | 1,606,495 | 4 | Asia | 70,081 | 304,786 | ||
Comparison with other destinations
The following is a comparative summary of Brazil's tourism industry key performance indicators as compared with countries considered among the most popular destinations in Latin America, and relevant economic indicators are included to show the relative importance that international tourism has on the economy of the selected countries.
| Selected Caribbean and Latin American countries |
Internl. tourist arrivals 2012[3] (x1000) |
Internl. tourism receipts 2012 USD ) |
Receipts per arrival 2012 (col 2)/(col 1) ( USD ) |
Arrivals per capita per 1000 pop. (estimated) 2007[20][34] |
Receipts per capita 2005 USD |
Revenues as % of exports goods and services[25] 2003 |
Tourism revenues as % 2012 |
% Direct & indirect employment in tourism[6][25] 2012 |
World Ranking Tourism Compet.[6] TTCI 2013 |
Index value TTCI[6] 2013 |
|---|---|---|---|---|---|---|---|---|---|---|
| 5,599 | 4,895 | 874 | 115 | 57 | 7.4 | 10.5 | 9.9 | 61 | 4.17 | |
| 5,677 | 6,645 | 1,170 | 26 | 18 | 3.2 | 8.9 | 8.1 | 51 | 4.37 | |
| 3,554 | 2,201 | 619 | 151 | 73 | 5.3 | 8.4 | 8.0 | 56 | 4.29 | |
| 2,175 | 2,351 | 1,081 | 26 | 25 | 6.6 | 5.1 | 5.5 | 84 | 3.90 | |
| 2,343 | 2,425 | 1,035 | 442 | 343 | 17.5 | 12.5 | 11.7 | 47 | 4.44 | |
| 2,688 | 2,283 | 849 | 188 | 169 | n/d | n/d | n/d | n/d | n/d | |
| 4,563 | 4,549 | 997 | 408 | 353 | 36.2 | 14.7 | 13.6 | 86 | 3.88 | |
| 1,986 | 2,043 | 1,029 | 628 | 530 | 49.2 | 25.7 | 23.8 | 67 | 4.08 | |
| 23,403 | 12,739 | 544 | 201 | 103 | 5.7 | 12.4 | 13.7 | 44 | 4.46 | |
| 1,606 | 2,259 | 1,406 | 330 | 211 | 10.6 | 10.1 | 9.6 | 37 | 4.54 | |
| 2,846 | 2,657 | 933 | 65 | 41 | 9.0 | 9.1 | 7.8 | 73 | 4.00 | |
| 2,695 | 2,076 | 770 | 525 | 145 | 14.2 | 10.2 | 9.7 | 59 | 4.23 |
- Notes: Green shadow denotes the country with the top indicator. Yellow shadow corresponds to Brazilian indicators.
(1) Visitors and receipts for Cuba correspond to 2011.
Tourist visa

Tourist visas also applies to
Amusement parks
In 2023, according to the "Best Amusement and Water Parks" ranking, from the "Travelers' Choice" award, from the
Paleontological tourism
Geopark Paleorrota is the main area of
In the region
Ecotourism

Domestic tourism
Domestic tourism is a key market segment for the tourism industry in Brazil. In 2005, 51 million Brazilian nationals made ten times more trips than foreign tourists and spent five times more money than their international counterparts.[27] The main destination states in 2005 were São Paulo (27.7%), Minas Gerais (10.8%), Rio de Janeiro (8.4%), Bahia (7.4%), and Santa Catarina (7.2%). The top three states by trip origin were São Paulo (35.7%), Minas Gerais (13.6%).[27]
In terms of tourism revenues, the top earners by state were São Paulo (16.4%) and Bahia (11.7%). For 2005, the three main trip purposes were visiting friends and family (53.1%), sun and beach (40.8%), and cultural tourism (12.5%).[24]
Tourism by regions of Brazil
.jpg)

.jpeg)
- Southeast Region:
- Rio de Janeiro: Rio de Janeiro, Angra dos Reis, Paraty, Resende, Visconde de Mauá, Itatiaia National Park, Petrópolis, Vassouras, Teresópolis, Serra dos Órgãos, Nova Friburgo, Saquarema, Arraial do Cabo, Cabo Frio, Búzios, Ilha Grande;
- ;
- Minas Gerais: Belo Horizonte, Sabará, Ouro Preto, Congonhas, Mariana, Lavras, São João del-Rei, Tiradentes, Diamantina, Serro, Araxá, Caxambu, São Lourenço, São Thomé das Letras, Capitólio, Camanducaia, Caparaó National Park, Pico da Bandeira, Serra do Cipó National Park, Serra da Canastra National Park;
- Itu, Jaú.
- Southern Region:
- Center-West Region:
- Federal District: Brasília;
- Goiás: Goiânia, Chapada dos Veadeiros National Park, Pirenópolis, Goiás Velho, Caldas Novas, Emas National Park, Araguaia River;
- Barão de Melgaço, Poconé;
- Mato Grosso do Sul: Campo Grande, Corumbá, Bonito, Ponta Porã, Aquidauana, Coxim, Jardim.
- Northeast Region:
- Bahia: Salvador, Cachoeira, Lençóis, Morro de São Paulo, Ilhéus, Itacaré, Porto Seguro, Arraial d'Ajuda, Trancoso, Chapada Diamantina National Park, Abrolhos Marine National Park;
- Catimbau Valley, Petrolina;
- Ceará: Fortaleza, Aracati, Canoa Quebrada, Jericoacoara, Tatajuba, Camocim, Sobral, Baturité, Ubajara National Park, Juazeiro do Norte;
- Sergipe: Aracaju, Laranjeiras, São Cristóvão, Estância, Propriá;
- Alagoas: Maceió, Maragogi, Penedo, Barra de São Miguel, Paripueira, Porto de Pedras;
- Ingá, Baía da Traição, Sousa;
- Rio Grande do Norte: Natal, Mossoró, Tibau do Sul, Tibau, Parnamirim, Touros, São Miguel do Gostoso, Galinhos, Caicó, Macau, Martins, Maxaranguape, Cape São Roque;
- Piauí: Teresina, Sete Cidades National Park, Parnaíba, Serra da Capivara National Park;
- Carolina.
- North Region:
- Mamirauá;
- Santarém;
- ;
- Amapá: Macapá, Oiapoque;
- Monte Roraima;
- Rondônia: Porto Velho, Guajará-Mirim, Guaporé Valley;
- Acre: Rio Branco, Xapuri, Brasiléia, Assis Brasil.
Gallery
-
-

-
 Gramado, in Rio Grande do Sul, is one of the most sought after for domestic tourism in Brazil
 -
 Armação dos Búzios in Rio de Janeiro State
 -
 Pantanal in Mato Grosso
 -
 Bonito in Mato Grosso do Sul
 -
 Hiking in Serra do Rio do Rastro, Santa Catarina
 -
 Swiss village in Campos do Jordão, São Paulo State
 -

-
 Paraty in Rio de Janeiro State
 -
 Vineyards valley in Rio Grande do Sul
 -

-

-
 Mel Island in Paraná
 -
 A resort in Porto de Galinhas
 -

-
 The Basilica of Our Lady of Aparecida is the second largest Catholic church in the world in interior area after the St. Peter's Basilica in the Vatican City.
 -
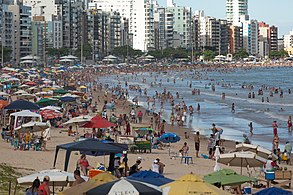
 Ponta Verde beach in Maceió
 -
-
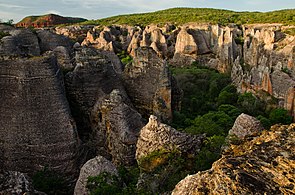 Serra da Capivara National Park in Piauí
 -
 The colonial city of Ouro Preto, a World Heritage Site, is one of the most popular destinations in Minas Gerais


.jpg)
.jpg)

.jpg)


See also
- Visa policy of Brazil
- Ministry of Tourism (Brazil)
- Tourism in the city of São Paulo
- Seven Wonders of Brazil
References
- ^ O Globo (18 March 2014). "Praia de Fernando de Noronha é eleita a mais bonita do mundo". Retrieved 4 January 2018.
- ISBN 9789284418145.
- ^ World Tourism Organization (UNWTO). June 2013. Archived from the original(PDF) on 2013-11-27. Retrieved 2014-04-14. pp. 10
- ^ a b Statistical Yearbook for Tourism 2020 base year 2019, page 331 of the PDF file (in Portuguese)
- ^ "The Travel & Tourism Competitiveness Report 2015" (PDF). World Economic Forum. May 2015.
- ^ a b c d e f Jennifer Blanke and Thea Chiesa, ed. (2013). "Travel & Tourism Competitiveness Report 2013" (PDF). World Economic Forum, Geneva, Switzerland. Retrieved 2013-04-14. See Table 4, pp. 18-19 and Country/Economy Profile: Brazil, pp. 116-117.
- ^ "The Travel & Tourism Competitiveness Report 2017" (PDF). World Economic Forum. April 2017.
- ^ a b c d World Tourism Organization (2005). "Tourism Market Trends, Annex 5, 2005 Edition" (PDF). Archived from the original (PDF) on 2007-02-20. Retrieved 2008-03-30.
- ^ a b c d e World Tourism Organization (2006). "Tourism Market Trends, Annex 12, 2006 Edition" (PDF). (Data corresponds to 2005). Retrieved 2008-03-30.
- ^ a b c World Tourism Organization (2007). "UNWTO Tourism Highlights, Edition 2007" (PDF). UNWTO. Archived from the original (PDF) on 2013-04-09. Retrieved 2008-06-14.
- ^ EMBRATUR (2008). "Principais Emissores de Turistas para o Brasil 2006-2007" (in Portuguese). Ministério de Turismo. Archived from the original on 2011-05-29. Retrieved 2008-06-19.
- ^ Facultade Getúlio Vargas (2008). "Boletim de Desempenho Econômico do Turismo" (in Portuguese). Ministério de Turismo. Archived from the original on 2011-05-29. Retrieved 2008-06-19. Janeiro 2008, Ano v, nº 17, pp. 2
- ^ a b EMBRATUR (2009). "Anuário Estatístico de Turismo 2009" (in Portuguese). Ministério de Turismo. Retrieved 2008-09-05. See tables 1.1 and 3.8
- UNB. Retrieved 2008-02-01. Source Brazilian Central Bank
- ^ World Tourism Organization. 2010. Archived from the originalon 2013-06-07. Retrieved 2010-10-31. Click on the link "UNWTO Tourism Highlights" to access the pdf report.
- ^ World Tourism Organization. June 2011. Retrieved 2011-09-29.
- ISBN 9789284416899. Archivedfrom the original on 2017-10-24. Retrieved 2017-11-15. pp.10
- ^ )
- ^ )
- ^ a b World Tourism Organization (2008). "UNWTO World Tourism Barometer June 2008" (PDF). UNWTO. Archived from the original (PDF) on 2008-10-31. Retrieved 2008-08-08. Data corresponds to 2007
- ^ The World Tourism Organization. "Tourism Highlights 2006 [pdf]" (PDF). Archived from the original (PDF) on 2007-06-28. Retrieved 2006-01-06.
- ^ Facultade Getúlio Vargas (2007). "Boletim de Desempenho Econômico do Turismo" (PDF) (in Portuguese). Ministério de Turismo. Archived from the original (PDF) on 2008-10-03. Retrieved 2008-06-21. Fevereiro 2007, Ano IV, nº 13, pp. 3
- ^ a b Facultade Getúlio Vargas (2008). "Pesquisa Anual de Conjuntura Econômica do Turismo" (PDF) (in Portuguese). Ministério de Turismo. Archived from the original (PDF) on 2008-10-03. Retrieved 2008-06-22. Março 2008, Ano IV, pp. 11
- ^ a b Fundação Instituto de Pesquisas Econômicas e EMBRATUR (2006). "Caracterização e Dimensionamento do Turismo Domêstico no Brasil 2002 e 2006: Metodologia e Desenvolvimento" (PDF) (in Portuguese). Ministério do Turismo. Archived from the original (PDF) on 2006-11-30. Retrieved 2008-06-22.
- ^ a b c d Carmen Altés (2006). "El Turismo en América Latina y el Caribe y la experiencia del BID" (in Spanish). Inter-American Development Bank; Sustainable Development Department, Technical Paper Series ENV-149, Washington, D.C. p. 9 and 47. Retrieved 2008-06-14.
- ^ Margerida Coelho (2008). "Distribução Espacial da Ocupação no Setor de Turismo: Brasil e Regiões" (PDF) (in Portuguese). Instituto de Pesquisa Econômica Aplicada. Retrieved 2008-06-22.
- ^ a b c Fundação Instituto de Pesquisas Econômicas (2007). "Caracterização e Dimensionamento do Turismo Domêstico no Brasil 2002 e 2006" (PDF) (in Portuguese). Ministério do Turismo. Archived from the original (PDF) on 2008-10-03. Retrieved 2008-06-21.
- ^ Diretoria de Turismo (2006). "Boletim Anual São Paulo Turismo" (PDF) (in Portuguese). Prefeitura de São Paulo. Retrieved 2008-11-20.[dead link] see 2.1.3 "Receitas setor trurístico 2005".
- ^ EMBRATUR (2006). "Anúario Estatístico Volume 33 2006" (PDF) (in Portuguese). Ministério do Turismo. Archived from the original (PDF) on 2008-09-09. Retrieved 2008-06-22. Tables 4.1 a 4.4: Summary Brasil by trip purpose 2004-2005
- ^ "Aguarde, estamos redirecionando o site". Turismoemfoco.com.br. Retrieved 2013-10-02.
- ^ Rio de Janeiro was the most sought after city by Brazilians in 2020 (in Portuguese)
- ^ a b c "Anuário Estatístico de Turismo 2021 (Ano base 2020) - 1ª Edição" (PDF). Subsecretaria de Gestão Estratégica - SGE, Ministério do Turismo - MTur. November 2021. pp. 16, 17. Retrieved 1 March 2022.
- ^ a b "Anuário Estatístico de Turismo 2017 - Ano Base 2016". Archived from the original on 2017-09-09. Retrieved 2017-09-09.
- ^ United Nations. "UNData. Country profiles (1999-2005)". Retrieved 2008-08-08. Population estimated for 2007 (search values for each country profile)
- ^ "Tourist Via - Brazil". Archived from the original on 2015-01-15. Retrieved 2014-09-15.
- ^ Melhores parques de diversões do mundo: Brasil emplaca 4 no ranking de 2023 de site de viagens
- ^ Bonito é eleito o Melhor Destino de Ecoturismo do Brasil pela 16ª vez
- ^ Sustainable travel and ecotourism in Brazil
- .
- ^ The 50 best ecotourism destinations in Brazil
External links
- Brazilian Tourism Portal by Embratur (Brazilian Tourist Board)
- New York Times Travel Guides: Brazil