
Zapata County, Texas
Zapata County | |
|---|---|
UTC−5 (CDT) | |
| Congressional district | 28th |
| Website | www |
Zapata County is a
Zapata County comprises the Zapata, TX
The
Geography
According to the
Major highways
Adjacent counties and municipalities
- Webb County (north)
- Jim Hogg County (east)
- Starr County (southeast)
- Guerrero, Tamaulipas, Mexico (west)
National protected area
Demographics
| Census | Pop. | Note | %± |
|---|---|---|---|
| 1860 | 1,248 | — | |
| 1870 | 1,488 | 19.2% | |
| 1880 | 3,636 | 144.4% | |
| 1890 | 3,562 | −2.0% | |
| 1900 | 4,760 | 33.6% | |
| 1910 | 3,809 | −20.0% | |
| 1920 | 2,929 | −23.1% | |
| 1930 | 2,867 | −2.1% | |
| 1940 | 3,916 | 36.6% | |
| 1950 | 4,405 | 12.5% | |
| 1960 | 4,393 | −0.3% | |
| 1970 | 4,352 | −0.9% | |
| 1980 | 6,628 | 52.3% | |
| 1990 | 9,279 | 40.0% | |
| 2000 | 12,182 | 31.3% | |
| 2010 | 14,018 | 15.1% | |
| 2020 | 13,889 | −0.9% | |
| U.S. Decennial Census[4] 1850–2010[5] 2010–2020[6] 2020[1] | |||
| Race | Pop 2010 | Pop 2020 | % 2010 | % 2020 |
|---|---|---|---|---|
White (NH)
|
861 | 796 | 6.14% | 5.73% |
Black or African American (NH)
|
11 | 9 | 0.08% | 0.06% |
Alaska Native (NH)
|
16 | 7 | 0.11% | 0.05% |
| Asian (NH) | 28 | 16 | 0.2% | 0.12% |
| Some Other Race (NH) | 6 | 16 | 0.04% | 0.12% |
| Mixed/Multi-Racial (NH) | 12 | 46 | 0.09% | 0.33% |
| Hispanic or Latino | 13,084 | 12,999 | 93.34% | 93.59% |
| Total | 14,018 | 13,889 |
As of the 2020 United States census, there were 13,889 people, 4,689 households, and 3,254 families residing in the county.
As of the
There were 3,921 households, out of which 43.20% had children under the age of 18 living with them, 64.20% were married couples living together, 13.00% had a female householder with no husband present, and 19.30% were non-families. 17.50% of all households were made up of individuals, and 10.30% had someone living alone who was 65 years of age or older. The average household size was 3.10 and the average family size was 3.52.
In the county, the population was spread out, with 33.00% under the age of 18, 10.00% from 18 to 24, 24.10% from 25 to 44, 18.60% from 45 to 64, and 14.30% who were 65 years of age or older. The median age was 31 years. For every 100 females there were 96.80 males. For every 100 females age 18 and over, there were 93.70 males.
The median income for a household in the county was $24,635, and the median income for a family was $26,722. Males had a median income of $26,294 versus $14,579 for females. The
Government and politics
In the majority of U.S. presidential elections, Zapata County supported Democratic Party candidates. However, on three occasions, it gave record-setting margins to Republican presidential nominees, when it delivered the highest percentage of the vote of any county in the nation to them. First in 1896, when it gave 96.3% of the vote to William McKinley, though he lost Texas as a whole (with 30.8% of the statewide popular vote), but won the national election (with 51.0% of the nationwide popular vote). The second time in 1908, when William Howard Taft won 99.1% of the vote in the county, despite losing the state to Democrat William Jennings Bryan (and receiving just 22.4% of the statewide vote), but winning the national election (with 51.6% of the nationwide popular vote). The third and final time was in 1912, when it again gave then-incumbent President Taft 80.9% with it being his best county in the nation, but against the state and nation's preference for the Democratic victor, Woodrow Wilson (in the popular vote, Taft only received 9.5% statewide and 23.2% nationwide). It voted Republican for President (Warren G. Harding) in 1920, and then consistently voted Democratic until 2020, when Republican Donald Trump defeated Democrat Joe Biden 52%-47%, about the same as the statewide margin.[13] Zapata was the most Hispanic county to vote for Trump in 2020, as well as the county with the lowest non-Hispanic white population to do so.
| Year | Republican | Democratic | Third party | |||
|---|---|---|---|---|---|---|
| No. | % | No. | % | No. | % | |
| 2020 | 2,033 | 52.48% | 1,826 | 47.13% | 15 | 0.39% |
| 2016 | 1,029 | 32.75% | 2,063 | 65.66% | 50 | 1.59% |
| 2012 | 997 | 28.14% | 2,527 | 71.32% | 19 | 0.54% |
| 2008 | 919 | 32.07% | 1,939 | 67.66% | 8 | 0.28% |
| 2004 | 1,228 | 42.37% | 1,662 | 57.35% | 8 | 0.28% |
| 2000 | 953 | 36.43% | 1,638 | 62.61% | 25 | 0.96% |
| 1996 | 521 | 21.27% | 1,786 | 72.90% | 143 | 5.84% |
| 1992 | 866 | 26.65% | 2,052 | 63.16% | 331 | 10.19% |
| 1988 | 958 | 30.56% | 2,171 | 69.25% | 6 | 0.19% |
| 1984 | 1,214 | 43.34% | 1,577 | 56.30% | 10 | 0.36% |
| 1980 | 874 | 41.01% | 1,218 | 57.16% | 39 | 1.83% |
| 1976 | 462 | 27.47% | 1,216 | 72.29% | 4 | 0.24% |
| 1972 | 695 | 47.51% | 768 | 52.49% | 0 | 0.00% |
| 1968 | 251 | 20.71% | 909 | 75.00% | 52 | 4.29% |
| 1964 | 135 | 11.77% | 1,009 | 87.97% | 3 | 0.26% |
| 1960 | 260 | 27.81% | 675 | 72.19% | 0 | 0.00% |
| 1956 | 637 | 41.80% | 886 | 58.14% | 1 | 0.07% |
| 1952 | 526 | 46.02% | 616 | 53.89% | 1 | 0.09% |
| 1948 | 414 | 39.54% | 632 | 60.36% | 1 | 0.10% |
| 1944 | 43 | 7.86% | 501 | 91.59% | 3 | 0.55% |
| 1940 | 495 | 38.70% | 784 | 61.30% | 0 | 0.00% |
| 1936 | 34 | 10.76% | 282 | 89.24% | 0 | 0.00% |
| 1932 | 24 | 8.14% | 271 | 91.86% | 0 | 0.00% |
| 1928 | 19 | 6.03% | 296 | 93.97% | 0 | 0.00% |
| 1924 | 197 | 39.56% | 300 | 60.24% | 1 | 0.20% |
| 1920 | 98 | 66.22% | 50 | 33.78% | 0 | 0.00% |
| 1916 | 214 | 89.17% | 26 | 10.83% | 0 | 0.00% |
| 1912 | 199 | 100.00% | 0 | 0.00% | 0 | 0.00% |
Education
All of Zapata County is a part of the
Communities
There are no incorporated areas in Zapata County, hence there are no municipal governments.
Census-designated places
- Falcon Lake Estates
- Falcon Mesa
- Las Palmas
- Lopeño
- Los Lobos
- Medina
- Morales-Sanchez
- New Falcon
- Ramireno
- San Ygnacio
- Siesta Shores
- Zapata (county seat)
Gallery
-
 19th century Los Corralitos Building relocated from Zapata County to the National Ranching Heritage Center in Lubbock in West Texas
 -
 The western side of the Jesus Trevino Rancho building in theSan YgnacioHistoric District; note the structural similarity to Los Corralitos Building
 -
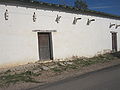
 A two-story historic residence in San Ygnacio onU.S. Highway 83business route
 -
 Entrance to Zapata County Cemetery from Farm-to-Market Road 496


See also
- National Register of Historic Places listings in Zapata County, Texas
- Recorded Texas Historic Landmarks in Zapata County
References
- ^ a b "2020 Census Data". data.census.gov.
- ^ "Find a County". National Association of Counties. Archived from the original on May 31, 2011. Retrieved June 7, 2011.
- ^ "2010 Census Gazetteer Files". United States Census Bureau. August 22, 2012. Retrieved May 12, 2015.
- US Census Bureau.
- ^ "Texas Almanac: Population History of Counties from 1850–2010" (PDF). Texas Almanac. Archived (PDF) from the original on October 9, 2022. Retrieved May 12, 2015.
- ^ "State & County QuickFacts". United States Census Bureau. Retrieved December 29, 2013.
- ^ "Explore Census Data". data.census.gov. Retrieved May 19, 2022.
- ^ "Explore Census Data". data.census.gov. Retrieved May 19, 2022.
- ^ https://www.census.gov/ [not specific enough to verify]
- ^ "About the Hispanic Population and its Origin". www.census.gov. Retrieved May 18, 2022.
- ^ "U.S. Census website". United States Census Bureau. Retrieved May 14, 2011.
- ^ "Congregational Membership Reports | US Religion". www.thearda.com. Retrieved October 12, 2023.
- ^ "President Donald J. Trump narrowly wins Zapata County". KRGV.
- ^ Leip, David. "Dave Leip's Atlas of U.S. Presidential Elections". uselectionatlas.org. Retrieved August 3, 2018.
- ^ Texas Education Code Sec. 130.185. LAREDO COMMUNITY COLLEGE DISTRICT SERVICE AREA.
External links
- Zapata County from the Handbook of Texas Online
- Current Hang Gliding Records
27°00′N 99°11′W / 27.00°N 99.18°W
Places adjacent to Zapata County, Texas | ||||||||||||||||
|---|---|---|---|---|---|---|---|---|---|---|---|---|---|---|---|---|
| ||||||||||||||||
Municipalities and communities of Zapata County, Texas, United States | ||
|---|---|---|
| CDPs |  | |
| ||
| International | |
|---|---|
| National | |
| Geographic | |
| Other | |