
King County, Texas
King County | |
|---|---|
UTC−5 (CDT) | |
| Congressional district | 13th |
| Website | www |
King County is a
History
Native Americans
The Apache and Comanche were early tribes in the area. The Red River War of 1874-1875 was a United States Army campaign to force the removal of Natives in Texas and their relocation to reservations, to open the region to white settlers.[4]
County established
On August 21, 1876, the Texas legislature formed King County from Bexar County. By 1880 the United States Census counted forty residents in the county. In 1891, the county was organized. Guthrie was designated as the county seat.[4]
Early ranchers preserved water by damming canyons and draws to hold the heavy spring rains. In the 1890s windmills became the method of water preservation.[5] Some of the earliest settlers were Isom Lynn, A. C. Tackett, Brants Baker, and Bud Arnett. The Four Sixes Ranch was established in 1902 by Samuel Burk Burnett.[6] The formerly-named Pitchfork Land and Cattle Company was organized in 1883, and SMS ranches were established during the same time frame.[7] The 6666 (called Four Sixes Ranch), also founded in 1883, was managed from 1965 to 1986 by George Humphreys, who was also affiliated with the National Ranching Heritage Center in Lubbock.
Dumont was formed in the late 19th century. By that time, farmers began to share the land with ranchers. Cotton was the leading crop for a time, followed by corn, sorghum, and fruit trees.[8]
Oil was discovered in the county in 1943. By January 1, 1991, almost 114,403,000 barrels (18,188,600 m3) of oil had been pumped from King County lands since the first wells were drilled.[4]
Geography
According to the United States Census Bureau, the county has a total area of 913 square miles (2,360 km2), of which 911 square miles (2,360 km2) is land and 2.5 square miles (6.5 km2) (0.3%) is water.[9]
Major highways
- U.S. Highway 82 / State Highway 114
- U.S. Highway 83
 State Highway 222
Adjacent counties
- Cottle County (north)
- Foard County (northeast)
- Knox County (east)
- Stonewall County (south)
- Dickens County (west)
- Haskell County (southeast)
Demographics
| Census | Pop. | Note | %± |
|---|---|---|---|
| 1880 | 40 | — | |
| 1890 | 173 | 332.5% | |
| 1900 | 490 | 183.2% | |
| 1910 | 810 | 65.3% | |
| 1920 | 655 | −19.1% | |
| 1930 | 1,193 | 82.1% | |
| 1940 | 1,066 | −10.6% | |
| 1950 | 870 | −18.4% | |
| 1960 | 640 | −26.4% | |
| 1970 | 464 | −27.5% | |
| 1980 | 425 | −8.4% | |
| 1990 | 354 | −16.7% | |
| 2000 | 356 | 0.6% | |
| 2010 | 286 | −19.7% | |
| 2020 | 265 | −7.3% | |
| 2022 (est.) | 233 | [10] | −12.1% |
| =U.S. Decennial Census[11] 1850–2010[12] 2010-2020[1] | |||
| Race / Ethnicity | Pop 2010[13] | Pop 2020[14] | % 2010 | % 2020 |
|---|---|---|---|---|
White alone (NH)
|
242 | 230 | 84.62% | 86.79% |
Black or African American alone (NH)
|
0 | 0 | 0.00% | 0.00% |
Alaska Native alone (NH)
|
1 | 0 | 0.35% | 0.00% |
| Asian alone (NH) | 0 | 0 | 0.00% | 0.00% |
| Pacific Islander alone (NH) | 0 | 4 | 0.00% | 1.51% |
| Some Other Race alone (NH) | 0 | 0 | 0.00% | 0.00% |
| Mixed Race/Multi-Racial (NH) | 4 | 6 | 1.40% | 2.26% |
| Hispanic or Latino (any race) | 39 | 25 | 13.64% | 9.43% |
| Total | 286 | 265 | 100.00% | 100.00% |
Note: the US Census treats Hispanic/Latino as an ethnic category. This table excludes Latinos from the racial categories and assigns them to a separate category. Hispanics/Latinos can be of any race.
As of the
There were 108 households, out of which 41.70% had children under the age of 18 living with them, 79.60% were married couples living together, 1.90% had a female householder with no husband present, and 17.60% were non-families. 16.70% of all households were made up of individuals, and 1.90% had someone living alone who was 65 years of age or older. The average household size was 2.77 and the average family size was 3.12.
In the county, the population was spread out, with 33.70% under the age of 18, 3.70% from 18 to 24, 29.50% from 25 to 44, 22.80% from 45 to 64, and 10.40% who were 65 years of age or older. The median age was 37 years. For every 100 females, there were 95.60 males. For every 100 females age 18 and over, there were 100.00 males.
The median income for a household in the county was $35,625, and the median income for a family was $36,875. Males had a median income of $21,389 versus $30,179 for females. The per capita income for the county was $12,321. 20.70% of the population and 17.90% of families were below the poverty line. Out of the total people living in poverty, 23.00% are under the age of 18 and 31.60% are 65 or older.
Politics
King County was once a strongly Democratic county even by
However, the county has shifted strongly Republican since the 1980s. The last Democratic presidential nominee to win over twenty percent of the vote in King County was Bill Clinton in 1996.[20] In 2016, by percentage of votes, it was the second most Republican county in the entire country, only being surpassed by Roberts County, Texas.
In the
In the
In the 2012 presidential election, President Obama fared even worse in King County. His Republican challenger, Mitt Romney, received 139 votes in the county (amounting to 95.9% of the county's total votes in the presidential election), while President Obama received only 5 votes — amounting to 3.4 percent of the total.[23][24] That percentage was the smallest percentage that President Obama received in any county in the United States in 2012.[24]
In addition, in the
In the
In
| Year | Republican | Democratic | Third party | |||
|---|---|---|---|---|---|---|
| No. | % | No. | % | No. | % | |
| 2020 | 151 | 94.97% | 8 | 5.03% | 0 | 0.00% |
| 2016 | 149 | 93.71% | 5 | 3.14% | 5 | 3.14% |
| 2012 | 139 | 95.86% | 5 | 3.45% | 1 | 0.69% |
| 2008 | 151 | 92.64% | 8 | 4.91% | 4 | 2.45% |
| 2004 | 137 | 87.82% | 18 | 11.54% | 1 | 0.64% |
| 2000 | 120 | 87.59% | 14 | 10.22% | 3 | 2.19% |
| 1996 | 97 | 53.30% | 46 | 25.27% | 39 | 21.43% |
| 1992 | 79 | 41.80% | 54 | 28.57% | 56 | 29.63% |
| 1988 | 111 | 63.43% | 64 | 36.57% | 0 | 0.00% |
| 1984 | 141 | 72.68% | 53 | 27.32% | 0 | 0.00% |
| 1980 | 144 | 70.24% | 55 | 26.83% | 6 | 2.93% |
| 1976 | 96 | 48.73% | 100 | 50.76% | 1 | 0.51% |
| 1972 | 143 | 65.30% | 75 | 34.25% | 1 | 0.46% |
| 1968 | 44 | 19.64% | 109 | 48.66% | 71 | 31.70% |
| 1964 | 34 | 15.89% | 180 | 84.11% | 0 | 0.00% |
| 1960 | 39 | 22.54% | 133 | 76.88% | 1 | 0.58% |
| 1956 | 46 | 20.54% | 177 | 79.02% | 1 | 0.45% |
| 1952 | 66 | 25.88% | 189 | 74.12% | 0 | 0.00% |
| 1948 | 6 | 2.49% | 231 | 95.85% | 4 | 1.66% |
| 1944 | 13 | 5.08% | 228 | 89.06% | 15 | 5.86% |
| 1940 | 23 | 7.96% | 266 | 92.04% | 0 | 0.00% |
| 1936 | 13 | 5.80% | 211 | 94.20% | 0 | 0.00% |
| 1932 | 4 | 1.75% | 224 | 98.25% | 0 | 0.00% |
| 1928 | 85 | 65.38% | 45 | 34.62% | 0 | 0.00% |
| 1924 | 4 | 4.60% | 83 | 95.40% | 0 | 0.00% |
| 1920 | 0 | 0.00% | 157 | 98.13% | 3 | 1.88% |
| 1916 | 3 | 6.00% | 47 | 94.00% | 0 | 0.00% |
| 1912 | 2 | 2.44% | 77 | 93.90% | 3 | 3.66% |
In the
In the
In the
Economy
The primary industries are raising beef cattle (since the late 19th century), and oil production (since 1943). Corn and cotton are the leading planted farm crops.
Communities
Education
School districts serving sections of the county include:[33]
The county is in the service area of Vernon College.[34]
Gallery
-
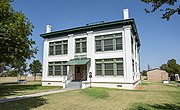 1914 King County Courthouse
 -
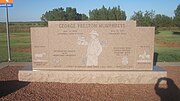 Monument offU.S. Highway 83 to George Preston Humphreys (1899-1979), the manager of the 6666 Ranch, who also served as King County sherifffrom 1928 to 1948
 -
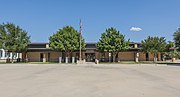 King County Courthouse in August 2020


See also
References
- ^ a b "State & County QuickFacts". United States Census Bureau. Retrieved December 13, 2023.
- ^ "Find a County". National Association of Counties. Archived from the original on May 31, 2011. Retrieved June 7, 2011.
- ^ "Texas: Individual County Chronologies". Texas Atlas of Historical County Boundaries. The Newberry Library. 2008. Archived from the original on May 13, 2015. Retrieved May 24, 2015.
- ^ a b c Leffler, John (June 15, 2010). "King County, Texas". Handbook of Texas Online. Texas State Historical Association. Retrieved December 13, 2010.
- ^ Coppedge, Clay. "Windmills". Texas Escapes. Texas Escapes - Blueprints For Travel, LLC. Retrieved December 13, 2010.
- ^ Chiles, Jim (June 1980). "Who Owns Texas". Texas Monthly: 124.
- ISBN 978-0-292-71189-1.
- ^ "Dumont, Texas". Texas Escapes. Texas Escapes - Blueprints For Travel, LLC. Retrieved December 13, 2010.
- ^ "2010 Census Gazetteer Files". United States Census Bureau. August 22, 2012. Retrieved May 2, 2015.
- ^ "Annual Estimates of the Resident Population for Counties: April 1, 2020 to July 1, 2022". Retrieved December 13, 2023.
- ^ "U.S. Decennial Census". United States Census Bureau. Retrieved March 26, 2015.
- ^ "Texas Almanac: Population History of Counties from 1850–2010" (PDF). Texas Almanac. Archived (PDF) from the original on October 9, 2022. Retrieved May 2, 2015.
- ^ "P2 HISPANIC OR LATINO, AND NOT HISPANIC OR LATINO BY RACE - 2010: DEC Redistricting Data (PL 94-171) - King County, Texas". United States Census Bureau.
- ^ "P2 HISPANIC OR LATINO, AND NOT HISPANIC OR LATINO BY RACE - 2020: DEC Redistricting Data (PL 94-171) - King County, Texas". United States Census Bureau.
- ^ "U.S. Census website". United States Census Bureau. Retrieved May 14, 2011.
- ^ "David Leip's Presidential Election Atlas - 1948 statistics". Uselectionatlas.org. Retrieved November 26, 2012.
- ^ "Dave Leip's Atlas of U.S. Presidential Elections - Data Graphs". Retrieved November 28, 2014.
- ^ "Dave Leip's Atlas of U.S. Presidential Elections - Data Graphs". Retrieved November 28, 2014.
- ^ "Dave Leip's Atlas of U.S. Presidential Elections - Data Graphs". Retrieved November 28, 2014.
- ^ "Dave Leip's Atlas of U.S. Presidential Elections - Data Graphs". Retrieved November 28, 2014.
- ^ "Dave Leip's Atlas of U.S. Presidential Elections - Data Graphs". Retrieved November 28, 2014.
- ^ "America's Decision - Election Tracking Map". Fox News. Retrieved November 7, 2008.
- ^ 2012 Texas Presidential Election Results, from Politico. Retrieved on November 15, 2012.
- ^ a b CNN, Video: Visit the most anti-Obama county in the U.S., from YouTube. Retrieved December 4, 2012.
- Texas Secretary of State. Retrieved on September 18, 2013.
- ^ Texas results in the 2016 presidential election, from Politico. Retrieved November 22, 2016.
- ^ Leip, David. "Dave Leip's Atlas of U.S. Presidential Elections". uselectionatlas.org. Retrieved July 26, 2018.
- ^ "Dave Leip's Atlas of U.S. Presidential Elections - Data Graphs". Retrieved November 28, 2014.
- ^ "Dave Leip's Atlas of U.S. Presidential Elections - Data Graphs". Retrieved November 28, 2014.
- ^ "Dave Leip's Atlas of U.S. Presidential Elections - Data Graphs". Retrieved November 28, 2014.
- ^ "Current Texas House Districts" (PDF).
- ^ "Current Texas Senate Districts" (PDF).
- ^ Texas Education Code, Sec. 130.207. VERNON REGIONAL JUNIOR COLLEGE DISTRICT SERVICE AREA.
External links
- King County from the Handbook of Texas Online
- King County Profile from the Texas Association of Counties
- King County website
Places adjacent to King County, Texas | ||||||||||||||||
|---|---|---|---|---|---|---|---|---|---|---|---|---|---|---|---|---|
| ||||||||||||||||
Municipalities and communities of King County, Texas, United States | ||
|---|---|---|
| CDP |  | |
| Other communities | ||
| ||
33°37′N 100°15′W / 33.61°N 100.25°W
| International | |
|---|---|
| National | |
| Other | |