
Demographics of Colombia
| Demographics of 174th) | |
|---|---|
| Growth rate | |
| Birth rate | 9.8 births/1,000 population (2023 est.) |
| Death rate | 5.1/1,000 population (2023 est.) |
| Life expectancy | 79 (34th) |
| • male | 76 (37th) |
| • female | 83 (22nd) |
| Fertility rate | 1.7 children/woman (2023 official) [3][4] |
| Net migration rate | |
| Age structure | |
| 0–14 years | 24.5% |
| 15–64 years | 64.1% |
| 65 and over | 11.4% |
| Sex ratio | |
| Total | 1.03 male(s)/female |
| Under 15 | 1.02 male(s)/female |
| 15–64 years | 0.95 male(s)/female |
| 65 and over | 0.75 male(s)/female |
| Nationality | |
| Nationality | Colombian |
| Major ethnic | No ethnic affiliation (87.58%)[6] |
| Minor ethnic | |
| Language | |
| Spoken | Spanish, Quimbaya, Chibchas other indigenous languages. |
The demographics of Colombia consist of statistics regarding Colombians' health, economic status, religious affiliations, ethnicity, population density, and other aspects of the population. Colombia is the second-most populous country in South America after Brazil, and the third-most populous in Latin America, after Brazil and Mexico.
Colombia's population has grown steadily for most of its history, although the growth rate slowed markedly in the late 20th century, due in part to emigration resulting from a sustained internal conflict. However, the economy has improved noticeably in recent decades, especially in urban areas, and living standards have risen in line with this.
Census
| Population history of Colombia |
 |
| Statoids.[8] National Censuses.[9][10] |
| Year | Pop. | ±% |
|---|---|---|
| 1864 | 1,694,487 | — |
| 1870 | 2,681,637 | +58.3% |
| 1905* | 4,533,777 | +69.1% |
| 1912 | 5,472,604 | +20.7% |
| 1918 | 5,855,077 | +7.0% |
| 1928 | 7,851,110 | +34.1% |
| 1938** | 8,701,816 | +10.8% |
| 1951 | 11,548,172 | +32.7% |
| 1964 | 17,484,508 | +51.4% |
| 1973 | 20,785,235 | +18.9% |
| 1985 | 27,837,932 | +33.9% |
| 1993 | 33,109,839 | +18.9% |
| 2005 | 41,468,384 | +25.2% |
| 2018 | 48,258,494 | +16.4% |
| *First census after 35 years **First modern census 2018 population census final estimate Note: Diverse sources Census respective year DANE Source: DANEDANE Simple[1] | ||


2021 Census
From January to October 2021, 9.5% of the babies were given birth by Venezuelan mothers. According to the entity during that period, there were 505,114 births and 48,075 were to Venezuelan mothers. In 2017, the birth rate of migrant mothers from Venezuela was 0%, but it has been increasing since 2020, when it was 9.1%.[11]
The births in Colombia have decreased, from 2015 to 2020, a 12.5% lower birth rate. In 2021 there were 12 births for every 1,000 people.[11]
2018 Census
According to the 2018 census, Colombia has 48,258,494 inhabitants within its territory.[13] All the data below is available in the DANE Census results.
Graphs are unavailable due to technical issues. There is more info on Phabricator and on MediaWiki.org. |
Graphs are unavailable due to technical issues. There is more info on Phabricator and on MediaWiki.org. |
Graphs are unavailable due to technical issues. There is more info on Phabricator and on MediaWiki.org. |
| Rank | Department | Census population | Change, 2005–2018 | Percent of the total Colombia population, 2018[note 1] | Population density | 2024 population projection | |||||
|---|---|---|---|---|---|---|---|---|---|---|---|
| Current | 2005 | 2018 | 2005 | Percent [note 2] |
Absolute | Extension km2 | Population density 2024 | Rank | 2024 population | ||
| 1 | 1 | Bogotá | 7,412,566 | 6,840,116 | 8.4% | +572,450 | 15.36% | 1,587 | 4,996.6 | 1 | 7,929,539 |
| 2 | 2 | Antioquia | 6,407,102 | 5,696,183 | 12.5% | +710,919 | 13.27% | 63,612 | 108.5 | 2 | 6,903,721 |
| 3 | 3 | Valle del Cauca
|
4,475,886 | 4,161,425 | 7.6% | +314,461 | 9.27% | 22,140 | 209.9 | 3 | 4,647,367 |
| 4 | 4 | Cundinamarca
|
2,919,060 | 2,280,037 | 28.0% | +639,023 | 6.05% | 24,210 | 146.8 | 4 | 3,553,293 |
| 5 | 5 | Atlántico
|
2,535,517 | 2,166,156 | 17.1% | +369,361 | 5.25% | 3,388 | 834.5 | 5 | 2,827,124 |
| 6 | 6 | Santander
|
2,184,837 | 1,957,789 | 11.6% | +227,048 | 4.53% | 30,537 | 77.8 | 6 | 2,376,736 |
| 7 | 7 | Bolívar
|
2,070,110 | 1,878,993 | 10.2% | +191,917 | 4.29% | 25,978 | 87.2 | 7 | 2,264,523 |
| 8 | 9 | Córdoba
|
1,784,783 | 1,467,929 | 21.6% | +316,854 | 3.70% | 25,020 | 76.5 | 8 | 1,914,778 |
| 9 | 8 | Nariño
|
1,630,592 | 1,541,956 | 5.7% | +88,636 | 3.38% | 33,268 | 51.4 | 9 | 1,709,890 |
| 10 | 13 | Norte de Santander
|
1,491,689 | 1,243,975 | 19.9% | +247,714 | 3.09% | 21,658 | 78.9 | 10 | 1,709,570 |
| 11 | 11 | Cauca
|
1,464,488 | 1,268,937 | 15.4% | +195,551 | 3.03% | 29,308 | 53.7 | 11 | 1,574,506 |
| 12 | 14 | Magdalena
|
1,341,746 | 1,149,917 | 16.7% | +191,829 | 2.78% | 23,188 | 65.3 | 12 | 1,513,782 |
| 13 | 10 | Tolima
|
1,330,187 | 1,365,342 | −2.6% | −35,155 | 2.76% | 23,562 | 58.6 | 14 | 1,380,948 |
| 14 | 12 | Boyacá
|
1,217,376 | 1,255,311 | −3.0% | −37,935 | 2.52% | 23,189 | 56.6 | 15 | 1,311,983 |
| 15 | 17 | Cesar
|
1,200,574 | 903,279 | 32.9% | +297,295 | 2.49% | 22,905 | 60.9 | 13 | 1,395,486 |
| 16 | 15 | Huila
|
1,100,386 | 1,011,418 | 8.8% | +88,968 | 2.28% | 19,890 | 59.9 | 16 | 1,192,273 |
| 17 | 19 | Meta
|
1,039,722 | 783,168 | 32.8% | +256,554 | 2.15% | 85,635 | 13.4 | 17 | 1,145,766 |
| 18 | 16 | Caldas
|
998,255 | 968,740 | 3.0% | +29,515 | 2.07% | 7,888 | 132.6 | 19 | 1,046,110 |
| 19 | 18 | Risaralda
|
943,401 | 897,509 | 5.1% | +45,892 | 1.95% | 4,140 | 235.2 | 21 | 973,879 |
| 20 | 20 | Sucre
|
904,863 | 772,010 | 17.2% | +132,853 | 1.88% | 10,917 | 92.2 | 20 | 1,006,044 |
| 21 | 21 | La Guajira
|
880,560 | 681,575 | 29.2% | +198,985 | 1.82% | 20,848 | 50.7 | 18 | 1,057,252 |
| 22 | 22 | Quindío
|
539,904 | 534,552 | 1.0% | +5,352 | 1.12% | 1,845 | 306.8 | 23 | 566,048 |
| 23 | 23 | Chocó
|
534,826 | 440,123 | 21.6% | +94,703 | 1.11% | 46,530 | 13.0 | 22 | 605,478 |
| 24 | 26 | Casanare
|
420,504 | 293,253 | 43.4% | +127,251 | 0.87% | 44,640 | 10.6 | 24 | 475,144 |
| 25 | 24 | Caquetá
|
401,489 | 420,337 | −4.5% | −18,848 | 0.83% | 88,965 | 4.8 | 25 | 428,162 |
| 26 | 25 | Putumayo
|
348,182 | 310,132 | 12.3% | +38,050 | 0.72% | 24,885 | 15.6 | 26 | 388,716 |
| 27 | 27 | Arauca
|
262,174 | 232,118 | 12.9% | +30,056 | 0.54% | 23,818 | 13.3 | 27 | 317,398 |
| 28 | 31 | Vichada
|
107,808 | 55,872 | 93.0% | +51,936 | 0.22% | 100,242 | 1.3 | 28 | 125,477 |
| 29 | 28 | Guaviare
|
82,767 | 95,551 | −13.4% | −12,874 | 0.17% | 53,460 | 1.9 | 29 | 100,497 |
| 30 | 30 | Amazonas | 76,589 | 67,726 | 13.1% | +8,863 | 0.16% | 109,665 | 0.8 | 30 | 86,318 |
| 31 | 29 | San Andrés y Providencia | 61,280 | 70,554 | −13.1% | −9,274 | 0.13% | 52 | 1,197.1 | 31 | 62,249 |
| 32 | 33 | Guainía
|
48,114 | 35,230 | 36.6% | +12,884 | 0.10% | 72,238 | 0.8 | 32 | 57,934 |
| 33 | 32 | Vaupés
|
40,797 | 39,279 | 3.9% | +1,518 | 0.08% | 54,135 | 0.9 | 33 | 47,961 |
| − | − | Colombia | 48,258,494 | 42,888,592 | 12.5% | +5,369,902 | - | 1,141,748 | 46.2 | - | 52,695,952 |
Current vital statistics by department
| Department (2023) | Crude birth rate
|
Crude death rate
|
Rate of natural increase | Fertility Rate | Expected number of births | Expected number of deaths | Life expectancy 2023[16] | ||
|---|---|---|---|---|---|---|---|---|---|
| Total | Rural | Urban | |||||||
| Antioquia | 8.6 | 5.2 | 3.4 | 1.1 | 1.7 | 0.9 | 58,922 | 35,247 | 77.0 |
| Atlántico | 11.3 | 5.1 | 6.2 | 1.4 | 0.8 | 1.4 | 31,707 | 14,213 | 76.3 |
| Bogotá | 7.7 | 4.3 | 3.4 | 0.89 | 0.5 | 0.9 | 60,905 | 34,318 | 79.1 |
| Bolívar | 13.3 | 4.7 | 8.6 | 1.6 | 1.3 | 1.7 | 29,896 | 10,472 | 77.1 |
| Boyacá | 8.7 | 5.4 | 3.3 | 1.2 | 1.5 | 1.1 | 11,317 | 7,007 | 79.7 |
| Caldas | 6.4 | 6.4 | 0.0 | 0.9 | 1.4 | 0.7 | 6,698 | 6,623 | 78.1 |
| Caquetá | 12.1 | 4.4 | 7.7 | 1.5 | 1.7 | 1.4 | 5,133 | 1,864 | 74.7 |
| Cauca | 9.1 | 4.3 | 4.8 | 1.1 | 1.1 | 1.0 | 14,102 | 6,655 | 78.7 |
| Cesar | 13.2 | 3.9 | 9.3 | 1.6 | 1.5 | 1.6 | 18,123 | 5,407 | 76.5 |
| Córdoba | 11.1 | 4.3 | 6.8 | 1.4 | 1.3 | 1.5 | 21,077 | 8,130 | 78.5 |
| Cundinamarca | 8.4 | 4.4 | 4.0 | 1.0 | 1.5 | 0.9 | 29,038 | 15,040 | 79.7 |
| Chocó | 10.9 | 3.1 | 7.8 | 1.3 | 0.9 | 1.7 | 6,509 | 1,851 | 76.9 |
| Huila | 12.8 | 5.4 | 7.4 | 1.6 | 1.9 | 1.5 | 15,136 | 6,355 | 76.3 |
| La Guajira | 19.5 | 3.0 | 16.5 | 2.2 | 2.4 | 2.1 | 20,233 | 3,115 | 68.3 |
| Magdalena | 13.3 | 4.4 | 8.9 | 1.6 | 1.4 | 1.7 | 19,845 | 6,519 | 76.7 |
| Meta | 11.4 | 4.8 | 6.6 | 1.4 | 1.4 | 1.4 | 12,865 | 5,419 | 75.1 |
| Nariño | 7.4 | 4.5 | 2.9 | 0.9 | 0.8 | 1.1 | 12,572 | 7,601 | 77.9 |
| Norte de Santander | 11.2 | 5.0 | 6.2 | 1.4 | 1.6 | 1.3 | 18,960 | 8,556 | 75.5 |
| Quindío | 7.5 | 7.5 | 0.0 | 1.0 | 1.0 | 1.0 | 4,224 | 4,202 | 76.4 |
| Risaralda | 8.4 | 6.9 | 1.5 | 1.1 | 1.6 | 1.0 | 8,187 | 6,703 | 76.8 |
| Santander | 9.3 | 5.1 | 4.2 | 1.2 | 1.5 | 1.1 | 21,873 | 11,966 | 78.5 |
| Sucre | 12.1 | 4.7 | 7.4 | 1.5 | 1.3 | 1.6 | 11,980 | 4,625 | 77.3 |
| Tolima | 9.5 | 6.3 | 3.2 | 1.3 | 1.5 | 1.2 | 13,010 | 8,693 | 76.6 |
| Valle del Cauca | 7.9 | 6.2 | 1.7 | 1.0 | 1.0 | 1.0 | 36,482 | 28,700 | 76.5 |
| Arauca | 11.0 | 3.6 | 7.4 | 1.3 | 1.6 | 1.2 | 3,429 | 1,132 | 74.3 |
| Casanare | 11.6 | 3.7 | 7.9 | 1.4 | 1.6 | 1.3 | 5,424 | 1,706 | 75.6 |
| Putumayo | 10.4 | 3.3 | 7.1 | 1.2 | 1.2 | 1.2 | 3,987 | 1,249 | 77.5 |
| San Andrés | 9.8 | 5.4 | 4.4 | 1.3 | 1.5 | 1.2 | 608 | 335 | 71.2 |
| Amazonas | 10.0 | 2.5 | 7.5 | 1.3 | 1.3 | 1.2 | 853 | 209 | 68.7 |
| Guainía | 12.7 | 2.6 | 10.1 | 1.5 | 1.8 | 1.4 | 720 | 146 | 63.1 |
| Guaviare | 11.5 | 3.5 | 8.0 | 1.4 | 2.0 | 1.1 | 1,124 | 338 | 70.1 |
| Vaupés | 14.4 | 2.6 | 11.8 | 2.1 | 2.6 | 1.2 | 673 | 120 | 60.7 |
| Vichada | 12.9 | 1.9 | 11.0 | 1.5 | 1.2 | 2.3 | 1,589 | 234 | 70.5 |
| Colombia | 9.8 | 5.1 | 4.7 | 1.22 | 510,357 | 265,047 | 77.23 | ||
20th and 21st centuries
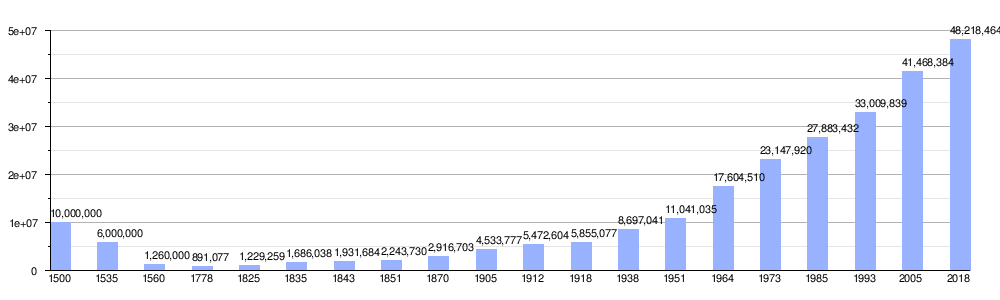
Colombian census from 1912:[17][18]
- On 1912 census estimated 5,472,604 inhabitants.
- On 1918 census estimated 5,855,077 inhabitants.
- On 1928 census estimated 7,851,110 inhabitants.
- On 1938 census estimated 8,697,041 inhabitants.
- On 1951 census estimated 11,548,172 inhabitants.
- On 1964 census estimated 17,484,508 inhabitants.
- On 1973 census estimated 20,785,234 inhabitants.
- On 1985 census estimated 27,837,932 inhabitants.
- On 1993 census estimated 33,109,839 inhabitants.
- On 2005 census estimated 42,888,592 inhabitants.
- On 2018 census estimated 48,258,494 inhabitants.
UN estimates
According to the 2022 revision of the World Population Prospects[19][20] the total population was 51,516,562 in 2021, compared to only 12,342,000 in 1950. The proportion of children below the age of 15 in 2015 was 24.3%, 68.7% was between 15 and 65 years of age, while 7% was 65 years or older .[21]
| Year | Total population ( × 1000) |
Population percentage in age bracket | ||
|---|---|---|---|---|
| 0–14 | 15–64 | 65+ | ||
| 1950 | 12 341 | 42.6% |
54.0% |
3.4% |
| 1955 | 14 225 | 44.8% |
52.0% |
3.2% |
| 1960 | 16 480 | 46.4% |
50.4% |
3.2% |
| 1965 | 19 144 | 46.9% |
49.9% |
3.2% |
| 1970 | 22 061 | 45.9% |
50.7% |
3.4% |
| 1975 | 24 757 | 43.4% |
53.0% |
3.6% |
| 1980 | 27 738 | 40.6% |
55.7% |
3.7% |
| 1985 | 31 012 | 37.9% |
58.2% |
3.9% |
| 1990 | 34 272 | 36.3% |
59.6% |
4.1% |
| 1995 | 37 442 | 34.3% |
61.3% |
4.4% |
| 2000 | 40 404 | 31.5% |
63.8% |
4.7% |
| 2005 | 43 286 | 28.9% |
65.9% |
5.2% |
| 2010 | 45 918 | 26.4% |
67.8% |
5.9% |
| 2015 | 48 229 | 24.3% |
68.7% |
7.0% |
| 2020 | 50 883 | 22.2% |
68.8% |
9.1% |
Structure of the population
| Age Group | Male | Female | Total | % |
|---|---|---|---|---|
| Total | 23 550 072 | 24 708 422 | 48 258 494 | 100 |
| 0–4 | 1 698 699 | 1 621 485 | 3 320 184 | 6.88 |
| 5–9 | 1 862 778 | 1 780 738 | 3 643 516 | 7.55 |
| 10–14 | 2 017 205 | 1 925 513 | 3 942 718 | 8.17 |
| 15–19 | 2 152 328 | 2 055 812 | 4 208 140 | 8.72 |
| 20–24 | 2 166 806 | 2 137 851 | 4 304 657 | 8.92 |
| 25–29 | 2 007 553 | 2 026 857 | 4 034 410 | 8.36 |
| 30–34 | 1 804 867 | 1 857 952 | 3 662 819 | 7.59 |
| 35–39 | 1 703 524 | 1 809 693 | 3 513 217 | 7.28 |
| 40–44 | 1 428 451 | 1 568 401 | 2 996 852 | 6.21 |
| 45–49 | 1 360 889 | 1 529 794 | 2 890 683 | 5.99 |
| 50–54 | 1 327 108 | 1 510 491 | 2 837 599 | 5.88 |
| 55–59 | 1 153 378 | 1 336 760 | 2 490 138 | 5.16 |
| 60–64 | 916 911 | 1 076 164 | 1 993 075 | 4.13 |
| 65–69 | 699 748 | 820 394 | 1 520 142 | 3.15 |
| 70–74 | 501 888 | 598 405 | 1 100 293 | 2.28 |
| 75–79 | 357 112 | 443 978 | 801 090 | 1.66 |
| 80+ | 415 967 | 582 994 | 998 961 | 2.07 |
| Age group | Male | Female | Total | Percent |
| 0–14 | 5 578 682 | 5 327 736 | 10 906 418 | 22.60 |
| 15–64 | 16 021 815 | 16 909 775 | 32 931 590 | 68.24 |
| 65+ | 1 974 715 | 2 445 771 | 4 420 486 | 9.16 |
Urbanization
Movement from rural to urban areas was very heavy in the middle of the twentieth century, but has since tapered off. The urban population increased from 29% of the total population in 1938, to 52% in 1964 and about 70% by 1990. Currently the figure is about 77%. The list of the most populated cities in the country only contains the population living in the urban area of the municipalities, according to the results of the 2018 population census.[23]
| Rank | Place name | 2023 projections | 2018 Census | 2005 Census | Change since 2018 |
|---|---|---|---|---|---|
| 1 | Bogotá | 7,875,975 | 7,412,566 | 6,776,691 | 6.61% |
| 2 | Medellín | 2,573,621 | 2,427,129 | 2,223,078 | 7.19% |
| 3 | Cali | 2,364,426 | 2,227,642 | 2,083,102 | 2.85% |
| 4 | Barranquilla | 1,322,933 | 1,205,284 | 1,142,451 | 9.76% |
| 5 | Cartagena
|
931,503 | 876,885 | 842,632 | 6.23% |
| 6 | Soacha | 778,364 | 655,025 | 396,544 | 18.83% |
| 7 | Cúcuta | 777,386 | 685,445 | 567,559 | 13.41% |
| 8 | Soledad | 675,127 | 602,644 | 460,745 | 12.03% |
| 9 | Bucaramanga | 605,047 | 570,752 | 509,135 | 6.01% |
| 10 | Bello | 546,902 | 495,483 | 358,167 | 10.38% |
| 11 | Villavicencio | 531,600 | 492,052 | 356,461 | 8.04% |
| 12 | Ibagué | 503,558 | 492,554 | 468,378 | 2.23% |
| 13 | Santa Marta
|
496,778 | 455,299 | 385,186 | 9.11% |
| 14 | Valledupar | 490,252 | 431,794 | 299,112 | 13.54% |
| 15 | Manizales | 430,259 | 405,234 | 353,138 | 6.17% |
| 16 | Pereira | 406,676 | 385,838 | 371,439 | 5.40% |
| 17 | Montería | 407,463 | 388,499 | 286,631 | 4.88% |
| 18 | Neiva
|
354,786 | 335,994 | 295,847 | 5.59% |
| 19 | Armenia
|
300,207 | 287,245 | 273,076 | 4.51% |
| 20 | Pasto | 319,661 | 308,095 | 312,480 | 3.75% |
| 21 | Floridablanca | 323,279 | 280,025 | 243,773 | 15.45% |
| 22 | Palmira | 285,389 | 275,254 | 228,056 | 3.68% |
| 23 | Itagüí | 273,885 | 247,918 | 213,187 | 10.47% |
| 24 | Popayán | 277,979 | 266,561 | 226,867 | 4.28% |
| 25 | Sincelejo | 273,124 | 249,323 | 219,655 | 9.54% |
| 26 | Envigado | 238,618 | 215,766 | 165,462 | 10.59% |
| 27 | Buenaventura | 249,730 | 235,064 | 292,889 | 6.24% |
| 28 | Dosquebradas | 215,644 | 204,280 | 169,820 | 5.55% |
| 29 | Barrancabermeja | 188,192 | 177,272 | 170,821 | 6.16% |
| 30 | Tuluá | 190,010 | 174,951 | 160,916 | 8.61% |
Vital statistics
UN estimates
The Population Departement of the United Nations prepared the following estimates.[24]
| Year | Average population | Live births | Deaths | Natural change | Crude birth rate (per 1000) | Crude death rate (per 1000) | Natural change (per 1000) | Total fertility rate |
|---|---|---|---|---|---|---|---|---|
| 1950 | 11,770 | 551,064 | 205,952 | 345,112 | 46.7 | 17.4 | 29.3 | 6.41 |
| 1951 | 12,090 | 565,988 | 205,240 | 360,748 | 46.7 | 17.0 | 29.7 | 6.44 |
| 1952 | 12,420 | 583,360 | 202,559 | 380,801 | 46.9 | 16.3 | 30.6 | 6.49 |
| 1953 | 12,770 | 600,964 | 199,936 | 401,028 | 47.0 | 15.6 | 31.4 | 6.54 |
| 1954 | 13,130 | 618,002 | 198,066 | 419,936 | 47.0 | 15.1 | 31.9 | 6.58 |
| 1955 | 13,510 | 635,597 | 196,985 | 438,612 | 47.0 | 14.5 | 32.5 | 6.63 |
| 1956 | 13,910 | 653,149 | 196,894 | 456,255 | 46.9 | 14.1 | 32.8 | 6.66 |
| 1957 | 14,330 | 671,025 | 190,300 | 480,725 | 46.7 | 13.3 | 33.4 | 6.70 |
| 1958 | 14,760 | 688,958 | 191,205 | 497,753 | 46.6 | 12.9 | 33.7 | 6.72 |
| 1959 | 15,210 | 705,451 | 187,724 | 517,727 | 46.3 | 12.3 | 34.0 | 6.74 |
| 1960 | 15,690 | 722,255 | 186,589 | 535,666 | 46.0 | 11.9 | 34.1 | 6.74 |
| 1961 | 16,180 | 738,333 | 186,049 | 552,284 | 45.6 | 11.5 | 34.1 | 6.71 |
| 1962 | 16,690 | 752,124 | 185,533 | 566,591 | 45.0 | 11.1 | 33.9 | 6.71 |
| 1963 | 17,210 | 763,468 | 184,487 | 578,981 | 44.3 | 10.7 | 33.6 | 6.58 |
| 1964 | 17,740 | 772,893 | 184,027 | 588,866 | 43.5 | 10.4 | 33.1 | 6.47 |
| 1965 | 18,280 | 776,098 | 183,487 | 592,611 | 42.4 | 10.0 | 32.4 | 6.33 |
| 1966 | 18,810 | 776,398 | 182,973 | 593,925 | 41.2 | 9.7 | 31.5 | 6.16 |
| 1967 | 19,340 | 774,512 | 182,646 | 591,866 | 40.0 | 9.4 | 30.6 | 5.96 |
| 1968 | 19,870 | 769,229 | 181,980 | 587,249 | 38.6 | 9.1 | 29.5 | 5.74 |
| 1969 | 20,390 | 762,378 | 180,816 | 581,562 | 37.3 | 8.9 | 28.4 | 5.51 |
| 1970 | 20,910 | 756,293 | 179,623 | 576,670 | 36.1 | 8.6 | 27.5 | 5.28 |
| 1971 | 21,410 | 751,603 | 177,215 | 574,388 | 35.0 | 8.3 | 26.7 | 5.06 |
| 1972 | 21,910 | 747,867 | 174,530 | 573,337 | 34.1 | 8.0 | 26.1 | 4.86 |
| 1973 | 22,400 | 749,007 | 172,407 | 576,600 | 33.4 | 7.7 | 25.7 | 4.68 |
| 1974 | 22,900 | 752,841 | 169,838 | 583,003 | 32.8 | 7.4 | 25.4 | 4.53 |
| 1975 | 23,400 | 761,181 | 167,106 | 594,075 | 32.5 | 7.1 | 25.4 | 4.40 |
| 1976 | 23,910 | 772,388 | 165,226 | 607,162 | 32.2 | 6.9 | 25.3 | 4.28 |
| 1977 | 24,440 | 783,971 | 163,447 | 620,524 | 32.0 | 6.7 | 25.3 | 4.18 |
| 1978 | 25,000 | 796,756 | 162,378 | 634,378 | 31.8 | 6.5 | 25.3 | 4.07 |
| 1979 | 25,580 | 811,077 | 162,475 | 648,602 | 31.7 | 6.3 | 25.4 | 3.97 |
| 1980 | 26,180 | 819,818 | 161,752 | 658,066 | 31.3 | 6.2 | 25.1 | 3.86 |
| 1981 | 26,790 | 829,626 | 162,670 | 666,956 | 30.9 | 6.1 | 24.8 | 3.74 |
| 1982 | 27,410 | 837,994 | 163,482 | 674,512 | 30.5 | 6.0 | 24.5 | 3.63 |
| 1983 | 28,040 | 842,011 | 165,467 | 676,544 | 30.0 | 5.9 | 24.1 | 3.53 |
| 1984 | 28,690 | 849,133 | 167,428 | 681,705 | 29.6 | 5.8 | 23.8 | 3.43 |
| 1985 | 29,330 | 855,217 | 191,701 | 663,516 | 29.1 | 6.5 | 22.6 | 3.34 |
| 1986 | 29,960 | 861,901 | 173,581 | 688,320 | 28.7 | 5.8 | 22.9 | 3.27 |
| 1987 | 30,600 | 868,789 | 178,536 | 690,253 | 28.4 | 5.8 | 22.6 | 3.21 |
| 1988 | 31,260 | 876,126 | 182,343 | 693,783 | 28.0 | 5.8 | 22.2 | 3.16 |
| 1989 | 31,920 | 884,747 | 186,089 | 698,658 | 27.7 | 5.8 | 21.9 | 3.12 |
| 1990 | 32,600 | 892,755 | 190,271 | 702,484 | 27.4 | 5.8 | 21.6 | 3.08 |
| 1991 | 33,270 | 899,439 | 193,733 | 705,706 | 27.0 | 5.8 | 21.2 | 3.05 |
| 1992 | 33,940 | 901,828 | 196,248 | 705,580 | 26.6 | 5.8 | 20.8 | 3.01 |
| 1993 | 34,610 | 903,555 | 197,750 | 705,805 | 26.1 | 5.7 | 20.4 | 2.97 |
| 1994 | 35,300 | 901,290 | 199,584 | 701,706 | 25.5 | 5.7 | 19.8 | 2.92 |
| 1995 | 35,970 | 897,429 | 200,808 | 696,621 | 24.9 | 5.6 | 19.3 | 2.86 |
| 1996 | 36,630 | 892,339 | 202,580 | 689,759 | 24.4 | 5.5 | 18.9 | 2.80 |
| 1997 | 37,290 | 885,195 | 204,267 | 680,928 | 23.7 | 5.5 | 18.2 | 2.74 |
| 1998 | 37,940 | 879,217 | 206,553 | 672,664 | 23.2 | 5.4 | 17.8 | 2.68 |
| 1999 | 38,590 | 874,245 | 209,686 | 664,559 | 22.6 | 5.4 | 17.2 | 2.63 |
| 2000 | 39,220 | 867,516 | 209,911 | 657,605 | 22.1 | 5.4 | 16.7 | 2.57 |
| 2001 | 39,840 | 859,788 | 213,177 | 646,611 | 21.6 | 5.4 | 16.2 | 2.52 |
| 2002 | 40,450 | 850,588 | 212,844 | 637,744 | 21.0 | 5.3 | 15.7 | 2.46 |
| 2003 | 41,060 | 839,623 | 212,707 | 626,916 | 20.4 | 5.2 | 15.2 | 2.40 |
| 2004 | 41,650 | 827,013 | 213,860 | 613,153 | 19.9 | 5.1 | 14.8 | 2.33 |
| 2005 | 42,220 | 813,688 | 214,241 | 599,447 | 19.3 | 5.1 | 14.2 | 2.26 |
| 2006 | 42,770 | 799,623 | 214,631 | 584,992 | 18.7 | 5.0 | 13.7 | 2.20 |
| 2007 | 43,310 | 787,414 | 216,353 | 571,061 | 18.2 | 5.0 | 13.2 | 2.14 |
| 2008 | 43,820 | 776,110 | 216,895 | 559,215 | 17.7 | 4.9 | 12.8 | 2.08 |
| 2009 | 44,310 | 765,905 | 217,753 | 548,152 | 17.3 | 4.9 | 12.4 | 2.03 |
| 2010 | 44,820 | 758,072 | 220,750 | 537,322 | 16.9 | 4.9 | 12.0 | 1.99 |
| 2011 | 45,310 | 752,881 | 224,162 | 528,719 | 16.6 | 4.9 | 11.7 | 1.96 |
| 2012 | 45,780 | 748,734 | 228,230 | 520,504 | 16.3 | 5.0 | 11.3 | 1.93 |
| 2013 | 46,240 | 744,381 | 233,264 | 511,117 | 16.1 | 5.0 | 11.1 | 1.90 |
| 2014 | 46,680 | 739,615 | 238,498 | 501,117 | 15.8 | 5.1 | 10.7 | 1.88 |
| 2015 | 47,120 | 734,664 | 243,633 | 491,031 | 15.6 | 5.2 | 10.4 | 1.86 |
| 2016 | 47,630 | 730,565 | 248,057 | 482,508 | 15.4 | 5.2 | 10.2 | 1.84 |
| 2017 | 48,350 | 726,008 | 252,689 | 473,319 | 15.1 | 5.2 | 9.9 | 1.82 |
| 2018 | 49,280 | 727,649 | 260,364 | 467,285 | 14.8 | 5.3 | 9.5 | 1.79 |
| 2019 | 50,190 | 733,940 | 270,504 | 463,436 | 14.7 | 5.4 | 9.3 | 1.76 |
| 2020 | 50,930 | 733,491 | 335,656 | 397,835 | 14.4 | 6.6 | 7.8 | 1.74 |
| 2021 | 51,520 | 730,233 | 397,649 | 332,584 | 14.2 | 7.7 | 6.5 | 1.72 |
| 2022 | 51,874 | 723,264 | 384,947 | 338,317 | 13.9 | 7.4 | 6.5 | 1.69 |
Official births and deaths statistics
| Year | Population | Live births | Deaths | Natural increase | Crude rate | Rate of natural increase | Crude migration increase | TFR | Life expectancy | Mother's mean age at first birth | ||
|---|---|---|---|---|---|---|---|---|---|---|---|---|
| birth | date | male | female | |||||||||
| 1998 | 38,012,359 | 720,984 | 175,363 | 545,621 | 18.9 | 4.6 | 14.3 | 2.17 | 66.1 | 74.2 | 26.27 | |
| 1999 | 38,585,016 | 746,194 | 183,553 | 562,641 | 19.3 | 4.7 | 14.5 | 0.3 | 2.22 | 66.6 | 74.6 | 26.25 |
| 2000 | 39,140,080 | 752,834 | 187,432 | 565,402 | 19.2 | 4.7 | 14.4 | -0.3 | 2.22 | 67.1 | 75.0 | 26.25 |
| 2001 | 39,674,811 | 724,319 | 191,513 | 532,806 | 18.2 | 4.8 | 13.4 | 0 | 2.12 | 67.6 | 75.4 | 26.26 |
| 2002 | 40,190,679 | 700,455 | 192,262 | 508,193 | 17.4 | 4.7 | 12.6 | 0.2 | 2.04 | 68.0 | 75.7 | 26.27 |
| 2003 | 40,693,254 | 710,702 | 192,121 | 518,581 | 17.4 | 4.7 | 12.7 | -0.4 | 2.05 | 68.5 | 76.1 | 26.23 |
| 2004 | 41,188,093 | 723,099 | 188,933 | 534,166 | 17.5 | 4.5 | 12.9 | -1.0 | 2.07 | 68.9 | 76.5 | 26.23 |
| 2005 | 41,671,878 | 719,968 | 189,022 | 530,946 | 17.2 | 4.5 | 12.7 | -1.1 | 2.05 | 69.3 | 76.8 | 26.22 |
| 2006 | 42,170,126 | 714,450 | 192,814 | 521,636 | 16.9 | 4.5 | 12.3 | -0.6 | 2.02 | 69.6 | 77.0 | 26.16 |
| 2007 | 42,658,630 | 709,253 | 193,936 | 515,317 | 16.6 | 4.5 | 12.0 | -0.6 | 1.98 | 69.9 | 77.3 | 26.11 |
| 2008 | 43,134,017 | 715,453 | 196,943 | 518,510 | 16.5 | 4.5 | 12.0 | -1.0 | 1.97 | 70.2 | 77.5 | 26.10 |
| 2009 | 43,608,630 | 699,775 | 196,933 | 502,842 | 16.0 | 4.5 | 11.5 | -0.7 | 1.91 | 70.5 | 77.7 | 26.08 |
| 2010 | 44,086,292 | 654,627 | 200,524 | 454,103 | 14.8 | 4.5 | 10.3 | 0.5 | 1.78 | 70.8 | 77.9 | 26.11 |
| 2011 | 44,553,416 | 665,499 | 195,823 | 469,676 | 14.9 | 4.3 | 10.5 | -0.1 | 1.79 | 71.1 | 78.1 | 26.14 |
| 2012 | 45,001,571 | 676,835 | 199,756 | 477,079 | 15.0 | 4.4 | 10.6 | -0.6 | 1.81 | 71.4 | 78.3 | 26.03 |
| 2013 | 45,434,942 | 658,835 | 203,071 | 455,764 | 14.5 | 4.4 | 10.0 | -0.5 | 1.75 | 71.7 | 78.5 | 26.08 |
| 2014 | 45,866,010 | 669,137 | 210,051 | 459,086 | 14.5 | 4.5 | 10.0 | -0.6 | 1.76 | 71.9 | 78.7 | 26.20 |
| 2015 | 46,313,898 | 660,999 | 219,472 | 441,527 | 14.2 | 4.7 | 9.5 | 0.1 | 1.73 | 72.2 | 78.9 | 26.35 |
| 2016 | 46,830,116 | 647,521 | 223,078 | 424,443 | 13.8 | 4.7 | 9.0 | 2.0 | 1.68 | 72.5 | 79.1 | 26.35 |
| 2017 | 47,419,200 | 656,704 | 227,624 | 429,080 | 13.8 | 4.8 | 9.0 | 3.4 | 1.69 | 72.7 | 79.3 | 26.41 |
| 2018 | 48,258,494 | 649,115 | 236,932 | 412,183 | 13.5 | 4.9 | 8.5 | 9.0 | 1.64 | 73.3 | 79.8 | 26.48 |
| 2019 | 49,395,678 | 642,660 | 244,355 | 398,305 | 13.0 | 4.9 | 8.0 | 15.3 | 1.59 | 73.5 | 79.9 | 26.49 |
| 2020 | 50,372,424 | 629,402 | 300,853 | 328,549 | 12.5 | 5.9 | 6.5 | 13.1 | 1.53 | 72.1 | 78.9 | 26.54 |
| 2021 | 51,049,498 | 616,914 | 363,089 | 253,825 | 12.1 | 7.1 | 4.9 | 8.4 | 1.49 | 69.7 | 76.9 | 26.55 |
| 2022 | 51,682,692 | 573,625 | 287,251 | 286,374 | 11.1 | 5.6 | 5.5 | 6.8 | 1.37 | 72.1 | 78.5 | 26.76 |
| 2023 | 52,215,503 | 510,748 | 265,282 | 245,466 | 9.8 | 5.1 | 4.7 | 1.22 | 74.5 | 80.1 | 26.92 | |
Current vital statistics
| Period | Live births | Deaths | Natural increase |
|---|---|---|---|
| January-April 2023 | 170,205 | 86,972 | +83,233 |
| January-April 2024 | 145,416 | 88,959 | +56,457 |
| Difference |
Ethnicity
Colombia is ethnically diverse, its original people descending from the original
The 2005 census (outdated) reported that the "non-ethnic population", consisting of
Many of the
The Organización Nacional Indígena de Colombia (ONIC), founded at the first National Indigenous Congress in 1982, is an organization representing the indigenous peoples of Colombia. In 1991, Colombia signed and ratified the current international law concerning indigenous peoples, Indigenous and Tribal Peoples Convention, 1989.[37]
Many immigrant communities have settled on the Caribbean coast, in particular recent immigrants from the
Languages
Spanish (of which Colombia has the third-largest population of speakers in the world after Mexico and the United States) is the official language, with 99.2% of Colombians speaking Spanish, and there are small communities in urban areas speaking other European languages such as German, French, English, Italian, and Portuguese. There are 65 indigenous languages and two Creole languages, one Creole in San Basilio de Palenque and one in San Andrés; and also San Andrés is the only place of Colombia where are three official languages: Spanish, English and a creole language.[45][46][47]
Religion
The
While Colombia remains a mostly Roman Catholic country by baptism numbers, the 1991 Colombian constitution guarantees freedom of religion and all religious faiths and churches are equally free before the law.[51]
Migration
Historically, a sizable percentage of Colombian emigration has also been motivated by the need to escape from political persecution and bipartisan violence during the periods of "
Colombians have emigrated in comparably high rates to the United States. Other Colombians migrated to Canada and Europe (most to Spain, but also to France, Italy, the United Kingdom and Sweden). Among other locations.[citation needed]
| Country of birth | 2018[52] | |
|---|---|---|
| Number | % | |
| 2,837,900 | 86.96% | |
| 150,124 | 2.09% | |
| 58,111 | 1.88% | |
| 44,954 | 1.55% | |
| 5,481 | 0.57% | |
| 5,220 | 0.54% | |
| 5,088 | 0.53% | |
| 4,218 | 0.44% | |
| 4,182 | 0.43% | |
| 3,104 | 0.32% | |
| 2,954 | 0.31% | |
| 2,909 | 0.30% | |
| 2,383 | 0.25% | |
| 2,133 | 0.22% | |
| 1,675 | 0.17% | |
| 1,591 | 0.17% | |
| 1,570 | 0.16% | |
| Country of residency | 2020[53] | |
|---|---|---|
| Number | % | |
| 1,557,000 | 40.91% | |
| 1,000,000 | 28.31% | |
| 481,000 | 8.75% | |
| 279,000 | 5.07% | |
| 198,500 | 3.61% | |
| 135,000 | 2.45% | |
| 86,000 | 1.56% | |
| 58,350 | 1.07% | |
| 50,000 | 0.91% | |
| 48,000 | 0.87% | |
| 43,500 | 0.79% | |
| 40,500 | 0.73% | |
| 40,000 | 0.72% | |
| 40,000 | 0.72% | |
| 24,000 | 0.44% | |
| 22,000 | 0.40% | |
| 20,000 | 0.36% | |
| 18,000 | 0.33% | |
| 15,000 | 0.27% | |
| 13,000 | 0.24% | |
| 12,000 | 0.22% | |
| 8,000 | 0.15% | |
| 8,000 | 0.15% | |
| 4,500 | 0.08% | |
| 4,000 | 0.07% | |
| 4,000 | 0.07% | |
| 3,500 | 0.06% | |
| 3,500 | 0.06% | |
| 3,000 | 0.05% | |
| 2,500 | 0.04% | |
| 2,500 | 0.04% | |
| 2,500 | 0.04% | |
| 2,000 | 0.03% | |
| 2,000 | 0.03% | |
| 2,000 | 0.03% | |
| 2,000 | 0.03% | |
| 1,500 | 0.02% | |
| 1,500 | 0.02% | |
| 1,300 | 0.02% | |
| 1,200 | 0.02% | |
| 1,000 | 0.01% | |
| 1,000 | 0.01% | |
CIA World Factbook demographic statistics


The following demographic statistics are from the
Population
48,637,910 (May 2016 est.)
Median age
total: 27.7 years
male: 26.7 years
female: 28.6 years (2010 est.)
Sex ratio
At birth: 1.03 male(s)/female
Under 15 years: 1.02 male(s)/female
15–64 years: 0.95 male(s)/female
65 years and over: 0.75 male(s)/female
total population: 0.96 male(s)/female (2009 est.)
HIV/AIDS – adult prevalence rate
0.7% (2007 est.)
HIV/AIDS – people living with HIV/AIDS
170,000 (2007 est.)
HIV/AIDS – deaths
9,800 (2007 est.)
Nationality
noun: Colombia adjective: Colombian(s)
Literacy
definition: age 15 and over can read and write
total population: 99.4%
male: 99.1% (2018 census)
female: 99.7% (2018 census)
Notes
References
- ^ "Proyecciones de Población DANE". Archived from the original on 10 April 2023. Retrieved 10 April 2023.
- ^ "Country Comparisons – Population growth rate". The World Factbook. Central Intelligence Agency. Retrieved 29 July 2021.
- ^ https://2023-wpds.prb.org/
- ^ https://www.prb.org/
- ^ "Flujos migratorios de colombianos y extranjeros" [Migratory flows of Colombians and foreigners] (PDF). micolombiadigital.gov.co (in Spanish). 31 December 2023. Retrieved 10 June 2024.
- ^ a b c d "visibilización estadística de los grupos étnicos". Censo General 2018. Departamento Administrativo Nacional de Estadistica (DANE). Retrieved 10 February 2020.
- ^ https://www.dane.gov.co/files/investigaciones/boletines/grupos-etnicos/presentacion-grupos-etnicos-2019.pdf [bare URL PDF]
- ^ "Colombia: Population history". Statoids. Retrieved 15 December 2015.
- ^ Calderón Schrader, Camilo. "Atlas básico de historia de Colombia". Revista Credencial Historia. Retrieved 15 December 2015.
- ^ "Caída de la población indígena en Colombia, 1500-1630: tres escenarios" (PDF). banrep.gov.co. Retrieved 7 April 2024.
- ^ a b Laura Ramírez (14 February 2022). "Nacimientos en Colombia: 9,5% fueron de madres venezolanas en 2021". Diario AS. Spain.
- ^ "En Colombia hay menos nacimientos, pero aumentaron los embarazos adolescentes". Infobae. 19 July 2022.
- ^ "Censo Nacional de Población y Vivienda 2018". Departamento Administrativo Nacional de Estadística - DANE. Retrieved 16 October 2019.
- ^ Note: Crude migration change % is trend analysis, an extrapolation-based average population change (current year minus previous) minus the natural change of the current year (see table vital statistics). The average population is an estimate of the population in the middle of the year and not the end of the year.
- ^ "Boletín técnico: nacimientos" (PDF). DANE. Retrieved 2 April 2024.
- ^ "Principales Indicadores – cambio demográfico nacional 2020-2070 y departamental 2020-2050 con base en el CNPV 2018". DANE. Retrieved 3 August 2023.
- ^ "La historia del censo en Colombia" Archived 5 December 2012 at archive.today. Caracol. 28 September 2005. Consulted 16 April 2012.
- ^ "Entrega de resultados Censo nacional de población y vivienda (CNPV)- 2018" (PDF). Departamento Administrativo Nacional de Estadística - DANE. Retrieved 5 July 2019.
- ^ "World Population Prospects 2022". United Nations Department of Economic and Social Affairs, Population Division. Retrieved 17 July 2022.
- ^ "World Population Prospects 2022: Demographic indicators by region, subregion and country, annually for 1950-2100" (XSLX) ("Total Population, as of 1 July (thousands)"). United Nations Department of Economic and Social Affairs, Population Division. Retrieved 17 July 2022.
- ^ "World Population Prospects". Population Division - United Nations. Retrieved 7 July 2016.
- ^ "Censo Nacional de Población y Vivienda 2018 - Herramientas - Explorador de datos". Departamento Administrativo Nacional de Estadística - DANE. Retrieved 10 November 2019.
- ^ "Población ajustada por cobertura - Censo Nacional de Población y Vivienda 2018". Departamento Administrativo Nacional de Estadística - DANE. Retrieved 9 November 2019.
- ^ "UN Population Division Data Portal". United Nations Population Division. Retrieved 3 August 2022.
- ^ "Departamento Administrativo Nacional de Estadística (DANE)". Departamento Administrativo Nacional de Estadística - DANE. Archived from the original on 25 April 2016. Retrieved 7 July 2016.
- ^ "Departamento Administrativo Nacional de Estadística (DANE) - Estimaciones del Cambio Demográfico 1950-2018". Departamento Administrativo Nacional de Estadística - DANE. Retrieved 5 July 2020.
- ^ "Nacimientos y Defunciones". Departamento Administrativo Nacional de Estadística - DANE. Retrieved 28 June 2022.
- ^ "Ethnic groups of Colombia". 2018 National Population and Housing Census. Departamento Administrativo Nacional de Estadística - DANE. Archived from the original on 8 April 2020. Retrieved 14 March 2020.
- ^ a b "The ethnic and cultural diversity of Colombia" (PDF). pedagogica.edu.co (in Spanish). Archived from the original (PDF) on 27 March 2014. Retrieved 26 March 2014.
- ^ Bushnell & Hudson, pp. 87–88.
- ^ Bushnell, David & Rex A. Hudson (2010) "The Society and Its Environment"; Colombia: a country study: pp. 87, 92. Washington D.C.: Federal Research Division, Library of Congress.
- ^ "Society and slavery". colombia.com (in Spanish). Retrieved 9 September 2013.
- ^ "Resguardos indígenas – Concentra el 43% de los bosques naturales". siac.gov.co (in Spanish). Archived from the original on 28 March 2014. Retrieved 27 March 2014.
- ^ "Hostein, N. (2010). El pueblo wayuu de la Guajira colombo-venezolana: un panorama de su cultura. Cuadernos de Antropología, 20(1)". Revistas.ucr.ac.cr. Retrieved 27 March 2014.
- ^ "Los pueblos indígenas de Colombia en el umbral del nuevo milenio. Población, cultura y territorio: bases para el fortalecimiento social y económico de los pueblos indígenas". dnp.gov.co. Retrieved 27 March 2014.
- ^ "visibilización estadística de los grupos étnicos" (PDF). Censo General 2005. Departamento Administrativo Nacional de Estadistica (DANE). Retrieved 15 June 2013.
- ^ "Ratifications for Colombia". International Labour Organization. Retrieved 26 March 2014.
- ^ "Ethnic groups in Colombia" (PDF) (in Spanish). Departamento Administrativo Nacional de Estadística - DANE. Archived from the original (PDF) on 3 March 2016. Retrieved 26 March 2014.
- ^ Luis Álvaro Gallo Martínez (2011). "Inmigrantes a Colombia: Personajes extranjeros llegados a Colombia" (PDF). rodriguezuribe.co. Archived from the original (PDF) on 24 September 2015.
- ^ Wabgou, M.; Vargas, D.; Carabalí, J. A. (2012). "Las migraciones internacionales en Colombia. Investigación & Desarrollo, 20(1) 142–167". Universidad del Norte.
- ^ Vargas Arana, Pilar, and Luz Marina Suaza Vargas. "Los árabes en Colombia: Del rechazo a la integración". (2007).
- ^ "The Arab immigration to Colombia". nodo50.org (in Spanish). Retrieved 30 January 2014.
- ^ "Características de los migrantes de Venezuela a Colombia" (PDF). Observatorio Laboral (in Spanish). 14 August 2017.
- ^ "Raza/Etnia a la que pertenece". Latinobarómetro 2023 Colombia. Retrieved 13 February 2024.
- ^ "Languages of Colombia" (in Spanish). banrepcultural.org. Archived from the original on 29 September 2013. Retrieved 9 October 2013.
- ^ "Jon Landaburu, Especialista de las lenguas de Colombia" (in Spanish). ambafrance-co.org. Archived from the original on 16 December 2013. Retrieved 9 October 2013.
- ^ "Map of the languages of Colombia" (in Spanish). lenguasdecolombia.gov.co. Archived from the original on 10 October 2017. Retrieved 9 October 2013.
- ^ a b "Religion in Latin America, Widespread Change in a Historically Catholic Region". pewforum.org. Pew Research Center. 13 November 2014.
- ^ ISBN 978-958-761-465-7. Archived from the original(PDF) on 27 March 2016. Retrieved 9 November 2016.
- ^ a b Beltrán Cely; William Mauricio. "Descripción cuantitativa de la pluralización religiosa en Colombia" (PDF). Universitas humanística 73 (2012): 201–238. – bdigital.unal.edu.co. Archived from the original (PDF) on 29 March 2014. Retrieved 9 November 2016.
- ^ Colombian Constitution of 1991 (Title II – Concerning rights, guarantees, and duties – Chapter I – Concerning fundamental rights – Article 19)
- ^ "Cruce de variables - Cruce de combinados - País de nacimiento". REDATAM - DANE. Retrieved 31 December 2022.
- ^ "Estudio de Caracterización de los Usuarios que atiende cada uno de los Consulados de Colombia en el Exterior" (PDF). Cancillería de Colombia. Retrieved 4 January 2023.
- ^ "The World Factbook". CIA. Retrieved 7 July 2016.
 This article incorporates public domain material from The World Factbook (2024 ed.).
External links
- (in Spanish) Colombian Department of Statistics
- (in Spanish) 1951 Census