
Talk:COVID-19 pandemic by country and territory/Archive 6
| This is an archive of past discussions. Do not edit the contents of this page. If you wish to start a new discussion or revive an old one, please do so on the current talk page. |
| Archive 1 | ← | Archive 4 | Archive 5 | Archive 6 | Archive 7 | Archive 8 | Archive 9 |
Map titled "Total confirmed deaths per million of COVID-19 by country and territory"
If I look at this chart on my computer, the data are always current. If I look at the article on my phone, though, the same chart always shows data from June 28th.
I don't know how to go about fixing this, but I'm putting this out there for anyone who understands how to deal with it and is willing to do so. Ormewood (talk) 19:02, 23 October 2020 (UTC)
- Ormewood. I don't see a chart in this article titled "Total confirmed deaths per million of COVID-19 by country and territory". Are you on the right talk page? --Timeshifter (talk) 03:19, 28 October 2020 (UTC)
- Timeshifter. Sorry. It's called that in its caption, but in the article it's under the heading "Map of death rates by country." Also, it's a map, not a chart. Ormewood (talk) 19:26, 28 October 2020 (UTC)
- Link to the map in question: https://en.wikipedia.org/wiki/COVID-19_pandemic_by_country_and_territory#/media/File:COVID-19_Outbreak_World_Map_Total_Deaths_per_Capita.svg Ormewood (talk) 20:25, 28 October 2020 (UTC)
- OK, Ormewood. Map section is currently here:
- COVID-19 pandemic by country and territory#Map of death rates by country
- Map is here:
- File:COVID-19 Outbreak World Map Total Deaths per Capita.svg
- Maybe try reloading that map page on your phone. To see if it refreshes the map to the new version. Also, then try reloading the article to see if it then incorporates the refreshed map.
- --Timeshifter (talk) 01:38, 29 October 2020 (UTC)
World Map Colors
When the US passes 10 million cases, what's going to happen to the color coding on the territory world map? Are they going to shift the colors upward again? I don't think there's a lighter shade of pink to use for the 0-99 case countries. Or will they add a new darker color for countries with 10 million + cases? For the 2009 Swine Flu pandemic map, they used black for the most affected countries. — Preceding unsigned comment added by 2600:1700:82E0:A690:74D0:E2C8:601A:E6FA (talk) 02:24, 29 October 2020 (UTC)
COVID-19 pandemic deaths#Monthly totals
Please see COVID-19 pandemic deaths#Cumulative monthly death totals by country. Can that table be copied to here too?
That table is enlightening. It clearly shows when any country peaked, slowed down, and started climbing up rapidly in deaths again.
It shows how some countries (US, UK, Brazil, etc.) are doing much worse when compared with other countries. And it shows when they started doing much worse.
Many countries plateaued in their numbers of deaths for long periods of time. This table allows people to see what is working in various countries. And for how long. It is invaluable info.
- User:Timeshifter/Sandbox123 - Non-collapsed table.
- User:Timeshifter/Sandbox124 - Collapsed table.
- User:Timeshifter/Sandbox125 - Narrower collapsed table. Haven't figured out how to make sorting row stay sticky and visible too.
class=covid-stickyonly seems to work on one row. That needs to be fixed.
I asked for help here:
- Template talk:COVID-19 pandemic data/styles.css - in the section currently titled: "On another template using this CSS need to make sorting row sticky too".
--Timeshifter (talk) 19:48, 17 October 2020 (UTC)
- I also asked for help here:
- Wikipedia:Village pump (technical)/Archive 185#Help is needed to make the header row with sorting icons sticky
- --Timeshifter (talk) 01:15, 25 October 2020 (UTC)
Collapsed table
See table wikitext here: User:Timeshifter/Sandbox124
| Date | Jan 11 | Feb 1 | Mar 1 | Apr 1 | May 1 | Jun 1 | Jul 1 | Aug 1 | Sep 1 | Oct 1 |
|---|---|---|---|---|---|---|---|---|---|---|
| World | 1 | 259 | 2,977 | 40,598 | 224,172 | 371,166 | 508,055 | 675,060 | 848,445 | 1,010,639 |
| Days to double | 6 | 4 | 16 | 8 | 18 | 37 | 56 | 70 | 80 | 94 |
| Countries and territories | 1 | 1 | 8 | 125 | 175 | 185 | 186 | 192 | 191 | 193 |
| 0 | 0 | 1 | 2,850 | 55,337 | 102,640 | 126,573 | 151,265 | 182,162 | 204,642 | |
| 0 | 0 | 0 | 159 | 5,466 | 28,834 | 58,314 | 91,263 | 120,828 | 142,921 | |
| 0 | 0 | 0 | 38 | 1,147 | 5,394 | 17,400 | 36,511 | 65,288 | 98,678 | |
| 0 | 0 | 0 | 28 | 1,732 | 9,779 | 27,121 | 46,000 | 64,158 | 77,163 | |
| 0 | 0 | 0 | 1,789 | 26,771 | 38,489 | 43,730 | 46,119 | 41,501 | 42,143 | |
| 0 | 0 | 29 | 12,430 | 27,967 | 33,415 | 34,767 | 35,141 | 35,483 | 35,894 | |
| 0 | 0 | 0 | 24 | 943 | 4,371 | 9,504 | 19,021 | 28,788 | 32,396 | |
| 0 | 0 | 0 | 8,189 | 24,543 | 29,045 | 28,355 | 28,445 | 29,141 | 31,791 | |
| 0 | 0 | 2 | 3,514 | 24,342 | 28,746 | 29,760 | 30,147 | 30,494 | 31,746 | |
| 0 | 0 | 43 | 2,898 | 6,028 | 7,797 | 10,817 | 16,766 | 21,571 | 26,169 | |
| 0 | 0 | 0 | 14 | 278 | 890 | 3,223 | 9,810 | 19,364 | 25,828 | |
| 0 | 0 | 0 | 17 | 1,169 | 4,855 | 9,536 | 14,058 | 17,299 | 20,891 | |
| 0 | 0 | 0 | 5 | 103 | 683 | 2,657 | 8,005 | 14,149 | 16,734 | |
| 0 | 0 | 0 | 24 | 215 | 530 | 1,283 | 3,466 | 8,498 | 16,519 | |
| 0 | 0 | 0 | 12 | 227 | 1,054 | 5,688 | 9,457 | 11,289 | 12,741 | |
| 0 | 0 | 0 | 75 | 900 | 3,358 | 4,527 | 5,702 | 6,556 | 11,355 | |
| 0 | 0 | 0 | 136 | 792 | 1,613 | 2,876 | 5,131 | 7,417 | 10,740 | |
| 0 | 0 | 0 | 705 | 7,594 | 9,467 | 9,754 | 9,841 | 9,897 | 10,020 | |
| 0 | 0 | 0 | 732 | 6,288 | 8,511 | 8,985 | 9,148 | 9,302 | 9,500 | |
| 0 | 0 | 0 | 89 | 3,082 | 7,092 | 8,566 | 8,929 | 9,117 | 9,291 | |
| 0 | 0 | 0 | 50 | 93 | 205 | 1,943 | 4,741 | 7,042 | 9,181 | |
| 0 | 0 | 0 | 214 | 3,174 | 4,540 | 5,131 | 5,691 | 6,370 | 8,195 | |
| 0 | 0 | 0 | 6 | 59 | 310 | 1,071 | 2,894 | 4,966 | 7,931 | |
| 0 | 0 | 0 | 26 | 385 | 1,543 | 4,395 | 5,951 | 6,298 | 6,479 | |
| 0 | 0 | 0 | 1,039 | 4,795 | 5,956 | 6,113 | 6,147 | 6,215 | 6,397 | |
| 0 | 0 | 0 | 46 | 392 | 959 | 2,953 | 4,805 | 5,421 | 5,914 | |
| 0 | 0 | 0 | 180 | 2,586 | 4,395 | 5,333 | 5,743 | 5,820 | 5,893 | |
| 0 | 0 | 1 | 88 | 568 | 957 | 1,266 | 2,023 | 3,558 | 5,504 | |
| 0 | 0 | 0 | 6 | 168 | 650 | 1,847 | 3,111 | 4,281 | 5,251 | |
| 0 | 0 | 0 | 69 | 717 | 1,262 | 1,651 | 2,343 | 3,621 | 4,825 | |
| 0 | 0 | 0 | 10 | 162 | 503 | 1,649 | 2,866 | 3,897 | 4,768 | |
| 1 | 259 | 2,873 | 3,321 | 4,643 | 4,645 | 4,648 | 4,668 | 4,730 | 4,746 | |
| 0 | 0 | 0 | 17 | 272 | 718 | 1,173 | 1,709 | 2,605 | 4,193 | |
| 0 | 0 | 0 | 1 | 16 | 102 | 746 | 1,924 | 2,760 | 3,246 | |
| 0 | 0 | 0 | 33 | 644 | 1,064 | 1,463 | 1,716 | 2,039 | 2,513 | |
| 0 | 0 | 0 | 24 | 178 | 330 | 620 | 1,397 | 1,995 | 2,364 | |
| 0 | 0 | 0 | 2 | 71 | 201 | 485 | 1,312 | 1,858 | 2,323 | |
| 0 | 0 | 0 | 36 | 170 | 205 | 228 | 353 | 1,141 | 2,152 | |
| 0 | 0 | 0 | 51 | 301 | 502 | 747 | 1,160 | 1,710 | 2,105 | |
| 0 | 0 | 0 | 2 | 25 | 41 | 188 | 793 | 1,878 | 2,075 | |
| 0 | 0 | 0 | 160 | 989 | 1,410 | 1,576 | 1,735 | 1,822 | 1,971 | |
| 0 | 0 | 0 | 71 | 1,232 | 1,652 | 1,736 | 1,763 | 1,777 | 1,804 | |
| 0 | 0 | 0 | 373 | 1,422 | 1,656 | 1,683 | 1,703 | 1,725 | 1,782 | |
| 0 | 0 | 0 | 35 | 450 | 653 | 912 | 1,210 | 1,510 | 1,736 | |
| 0 | 0 | 5 | 57 | 432 | 892 | 974 | 1,011 | 1,296 | 1,571 | |
| 0 | 0 | 0 | 21 | 223 | 285 | 319 | 493 | 961 | 1,543 | |
| 0 | 0 | 0 | 4 | 64 | 265 | 774 | 1,283 | 1,406 | 1,458 | |
| 0 | 0 | 0 | 3 | 119 | 295 | 547 | 778 | 995 | 1,320 | |
| 0 | 0 | 0 | 0 | 3 | 11 | 103 | 274 | 809 | 1,198 | |
| 0 | 0 | 0 | 1 | 58 | 287 | 590 | 879 | 1,013 | 1,112 | |
| 0 | 0 | 0 | 0 | 8 | 16 | 62 | 1,397 | 1,060 | 1,065 | |
| 0 | 0 | 0 | 3 | 33 | 139 | 453 | 749 | 881 | 963 | |
| 0 | 0 | 0 | 1 | 11 | 49 | 176 | 421 | 685 | 935 | |
| 0 | 0 | 0 | 20 | 92 | 103 | 104 | 196 | 652 | 886 | |
| 0 | 0 | 0 | 2 | 6 | 10 | 15 | 140 | 418 | 880 | |
| 0 | 0 | 0 | 12 | 68 | 152 | 185 | 324 | 603 | 849 | |
| 0 | 0 | 0 | 0 | 9 | 46 | 174 | 448 | 717 | 843 | |
| 0 | 0 | 0 | 3 | 9 | 11 | 17 | 47 | 308 | 841 | |
| 0 | 0 | 0 | 2 | 31 | 286 | 572 | 746 | 823 | 836 | |
| 0 | 0 | 0 | 0 | 89 | 235 | 392 | 559 | 681 | 833 | |
| 0 | 0 | 0 | 8 | 66 | 140 | 230 | 383 | 629 | 825 | |
| 0 | 0 | 0 | 128 | 584 | 668 | 705 | 718 | 733 | 799 | |
| 0 | 0 | 0 | 16 | 323 | 526 | 585 | 596 | 615 | 781 | |
| 0 | 0 | 0 | 13 | 179 | 243 | 277 | 573 | 713 | 749 | |
| 0 | 0 | 0 | 9 | 77 | 133 | 302 | 486 | 603 | 739 | |
| 0 | 0 | 0 | 1 | 17 | 64 | 148 | 341 | 577 | 711 | |
| 0 | 0 | 0 | 8 | 54 | 136 | 153 | 219 | 434 | 661 | |
| 0 | 0 | 0 | 31 | 236 | 320 | 349 | 382 | 424 | 655 | |
| 0 | 0 | 0 | 90 | 452 | 574 | 605 | 615 | 624 | 650 | |
| 0 | 0 | 0 | 3 | 10 | 14 | 48 | 158 | 381 | 621 | |
| 0 | 0 | 0 | 1 | 22 | 30 | 41 | 217 | 515 | 615 | |
| 0 | 0 | 0 | 0 | 26 | 212 | 354 | 447 | 531 | 610 | |
| 0 | 0 | 0 | 5 | 24 | 63 | 213 | 448 | 534 | 591 | |
| 0 | 0 | 0 | 0 | 2 | 81 | 313 | 494 | 567 | 588 | |
| 0 | 0 | 0 | 0 | 3 | 5 | 24 | 74 | 237 | 551 | |
| 0 | 0 | 0 | 0 | 0 | 8 | 29 | 56 | 228 | 498 | |
| 0 | 0 | 0 | 2 | 9 | 15 | 26 | 143 | 322 | 471 | |
| 0 | 0 | 0 | 6 | 61 | 191 | 313 | 391 | 414 | 418 | |
| 0 | 0 | 0 | 6 | 105 | 264 | 315 | 351 | 384 | 416 | |
| 0 | 0 | 18 | 165 | 248 | 271 | 282 | 301 | 324 | 415 | |
| 0 | 0 | 0 | 49 | 140 | 175 | 192 | 206 | 266 | 391 | |
| 0 | 0 | 0 | 13 | 31 | 33 | 65 | 157 | 284 | 387 | |
| 0 | 0 | 0 | 1 | 2 | 5 | 11 | 85 | 173 | 368 | |
| 0 | 0 | 0 | 12 | 24 | 27 | 34 | 59 | 167 | 361 | |
| 0 | 0 | 0 | 17 | 211 | 320 | 328 | 329 | 335 | 344 | |
| 0 | 0 | 0 | 0 | 3 | 7 | 24 | 151 | 288 | 332 | |
| 0 | 0 | 0 | 0 | 9 | 42 | 112 | 205 | 284 | 311 | |
| 0 | 0 | 0 | 1 | 6 | 6 | 6 | 6 | 6 | 310 | |
| 0 | 0 | 0 | 5 | 17 | 36 | 112 | 182 | 276 | 301 | |
| 0 | 0 | 0 | 6 | 69 | 103 | 107 | 145 | 186 | 280 | |
| 0 | 0 | 0 | 28 | 204 | 236 | 250 | 255 | 264 | 274 | |
| 0 | 0 | 0 | 8 | 31 | 71 | 169 | 214 | 258 | 272 | |
| 0 | 0 | 0 | 4 | 8 | 19 | 87 | 148 | 190 | 246 | |
| 0 | 0 | 0 | 10 | 41 | 48 | 50 | 50 | 77 | 246 | |
| 0 | 0 | 0 | 0 | 0 | 6 | 20 | 106 | 192 | 230 | |
| 0 | 0 | 0 | 0 | 7 | 41 | 105 | 161 | 201 | 229 | |
| 0 | 0 | 0 | 1 | 4 | 4 | 7 | 67 | 202 | 228 | |
| 0 | 0 | 0 | 2 | 10 | 38 | 113 | 174 | 197 | 214 | |
| 0 | 0 | 0 | 2 | 3 | 5 | 9 | 43 | 112 | 197 | |
| 0 | 0 | 0 | 2 | 2 | 4 | 13 | 51 | 108 | 183 | |
| 0 | 0 | 0 | 0 | 3 | 4 | 16 | 114 | 175 | 179 | |
| 0 | 0 | 0 | 2 | 7 | 9 | 12 | 49 | 100 | 170 | |
| 0 | 0 | 0 | 0 | 1 | 23 | 128 | 157 | 159 | 161 | |
| 0 | 0 | 0 | 1 | 4 | 35 | 74 | 116 | 137 | 151 | |
| 0 | 0 | 0 | 13 | 91 | 108 | 111 | 117 | 128 | 138 | |
| 0 | 0 | 0 | 43 | 102 | 115 | 121 | 125 | 127 | 136 | |
| 0 | 0 | 0 | 0 | 26 | 77 | 116 | 124 | 126 | 131 | |
| 0 | 0 | 0 | 23 | 90 | 110 | 110 | 114 | 124 | 124 | |
| 0 | 0 | 0 | 6 | 61 | 83 | 86 | 87 | 94 | 122 | |
| 0 | 0 | 0 | 0 | 0 | 0 | 0 | 10 | 75 | 121 | |
| 0 | 0 | 0 | 0 | 14 | 33 | 66 | 102 | 115 | 120 | |
| 0 | 0 | 0 | 1 | 1 | 1 | 2 | 9 | 96 | 112 | |
| 0 | 0 | 0 | 0 | 1 | 2 | 11 | 40 | 91 | 109 | |
| 0 | 0 | 0 | 1 | 7 | 9 | 10 | 10 | 21 | 107 | |
| 0 | 0 | 0 | 0 | 1 | 1 | 13 | 26 | 67 | 104 | |
| 0 | 0 | 0 | 0 | 28 | 78 | 90 | 93 | 98 | 99 | |
| 0 | 0 | 0 | 0 | 11 | 11 | 11 | 14 | 43 | 95 | |
| 0 | 0 | 0 | 7 | 45 | 70 | 78 | 80 | 86 | 92 | |
| 0 | 0 | 0 | 0 | 9 | 20 | 41 | 56 | 78 | 89 | |
| 0 | 0 | 0 | 0 | 3 | 65 | 74 | 75 | 77 | 85 | |
| 0 | 0 | 0 | 0 | 2 | 12 | 12 | 83 | 83 | 83 | |
| 0 | 0 | 0 | 0 | 16 | 27 | 36 | 75 | 82 | 82 | |
| 0 | 0 | 0 | 2 | 8 | 12 | 12 | 20 | 37 | 78 | |
| 0 | 0 | 0 | 0 | 0 | 47 | 52 | 60 | 68 | 76 | |
| 0 | 0 | 0 | 3 | 8 | 8 | 8 | 8 | 22 | 75 | |
| 0 | 0 | 0 | 0 | 0 | 0 | 0 | 3 | 32 | 75 | |
| 0 | 0 | 0 | 0 | 7 | 46 | 60 | 67 | 70 | 72 | |
| 0 | 0 | 0 | 3 | 32 | 64 | 67 | 69 | 69 | 69 | |
| 0 | 0 | 0 | 0 | 7 | 23 | 33 | 46 | 59 | 66 | |
| 0 | 0 | 0 | 0 | 1 | 1 | 15 | 43 | 59 | 66 | |
| 0 | 0 | 0 | 4 | 52 | 68 | 69 | 69 | 64 | 64 | |
| 0 | 0 | 0 | 0 | 0 | 2 | 47 | 59 | 62 | 62 | |
| 0 | 0 | 0 | 5 | 8 | 9 | 9 | 11 | 15 | 61 | |
| 0 | 0 | 0 | 0 | 2 | 24 | 54 | 58 | 60 | 61 | |
| 0 | 0 | 0 | 0 | 0 | 2 | 6 | 11 | 23 | 61 | |
| 0 | 0 | 0 | 1 | 1 | 4 | 15 | 23 | 40 | 60 | |
| 0 | 0 | 0 | 12 | 54 | 57 | 58 | 58 | 58 | 59 | |
| 0 | 0 | 0 | 14 | 43 | 53 | 53 | 53 | 55 | 57 | |
| 0 | 0 | 0 | 5 | 12 | 14 | 14 | 14 | 16 | 57 | |
| 0 | 0 | 0 | 1 | 3 | 17 | 42 | 49 | 53 | 54 | |
| 0 | 0 | 0 | 12 | 42 | 51 | 52 | 66 | 53 | 53 | |
| 0 | 0 | 0 | 2 | 5 | 5 | 5 | 5 | 10 | 49 | |
| 0 | 0 | 0 | 0 | 0 | 10 | 38 | 46 | 47 | 49 | |
| 0 | 0 | 0 | 1 | 9 | 13 | 14 | 18 | 27 | 48 | |
| 0 | 0 | 0 | 1 | 15 | 22 | 27 | 35 | 44 | 48 | |
| 0 | 0 | 0 | 0 | 23 | 28 | 28 | 29 | 33 | 48 | |
| 0 | 0 | 0 | 26 | 41 | 42 | 42 | 42 | 42 | 42 | |
| 0 | 0 | 0 | 0 | 4 | 23 | 35 | 39 | 40 | 42 | |
| 0 | 0 | 0 | 0 | 2 | 3 | 21 | 36 | 40 | 41 | |
| 0 | 0 | 0 | 0 | 6 | 12 | 15 | 17 | 19 | 40 | |
| 0 | 0 | 0 | 0 | 1 | 8 | 24 | 27 | 33 | 39 | |
| 0 | 0 | 0 | 0 | 15 | 24 | 30 | 32 | 34 | 37 | |
| 0 | 0 | 0 | 0 | 0 | 0 | 0 | 13 | 31 | 36 | |
| 0 | 0 | 0 | 0 | 0 | 0 | 0 | 2 | 34 | 35 | |
| 0 | 0 | 0 | 0 | 4 | 7 | 9 | 9 | 12 | 34 | |
| 0 | 0 | 0 | 0 | 0 | 5 | 8 | 16 | 28 | 34 | |
| 0 | 0 | 0 | 2 | 20 | 29 | 31 | 31 | 32 | 32 | |
| 0 | 0 | 0 | 0 | 0 | 1 | 2 | 5 | 16 | 29 | |
| 0 | 0 | 0 | 3 | 15 | 23 | 26 | 27 | 27 | 27 | |
| 0 | 0 | 0 | 0 | 2 | 2 | 2 | 2 | 13 | 26 | |
| 0 | 0 | 0 | 0 | 2 | 3 | 3 | 3 | 10 | 26 | |
| 0 | 0 | 0 | 1 | 19 | 22 | 22 | 22 | 22 | 25 | |
| 0 | 0 | 0 | 0 | 22 | 24 | 24 | 24 | 24 | 24 | |
| 0 | 0 | 0 | 8 | 20 | 17 | 19 | 19 | 21 | 22 | |
| 0 | 0 | 0 | 0 | 13 | 15 | 15 | 15 | 17 | 22 | |
| 0 | 0 | 0 | 2 | 14 | 14 | 14 | 15 | 16 | 21 | |
| 0 | 0 | 0 | 1 | 17 | 21 | 21 | 21 | 21 | 21 | |
| 0 | 0 | 0 | 0 | 4 | 6 | 6 | 8 | 14 | 20 | |
| 0 | 0 | 0 | 0 | 1 | 1 | 1 | 2 | 6 | 16 | |
| 0 | 0 | 0 | 0 | 0 | 1 | 2 | 4 | 5 | 16 | |
| 0 | 0 | 0 | 0 | 1 | 10 | 11 | 15 | 15 | 15 | |
| Other | 0 | 0 | 6 | 7 | 13 | 13 | 13 | 13 | 13 | 13 |
| 0 | 0 | 0 | 2 | 7 | 10 | 11 | 11 | 12 | 13 | |
| 0 | 0 | 0 | 1 | 13 | 13 | 13 | 13 | 13 | 13 | |
| 0 | 0 | 0 | 2 | 10 | 10 | 10 | 10 | 10 | 10 | |
| 0 | 0 | 0 | 5 | 10 | 10 | 10 | 10 | 10 | 10 | |
| 0 | 0 | 0 | 0 | 6 | 9 | 9 | 9 | 9 | 9 | |
| 0 | 0 | 0 | 2 | 3 | 3 | 3 | 3 | 5 | 8 | |
| 0 | 0 | 0 | 0 | 7 | 7 | 7 | 7 | 7 | 7 | |
| 0 | 0 | 0 | 0 | 0 | 2 | 7 | 7 | 7 | 7 | |
| 0 | 0 | 0 | 0 | 0 | 0 | 0 | 2 | 5 | 7 | |
| 0 | 0 | 0 | 0 | 0 | 0 | 0 | 0 | 0 | 7 | |
| 0 | 0 | 0 | 0 | 1 | 1 | 2 | 2 | 3 | 6 | |
| 0 | 0 | 0 | 1 | 1 | 2 | 3 | 3 | 3 | 3 | |
| 0 | 0 | 0 | 0 | 3 | 3 | 3 | 3 | 3 | 3 | |
| 0 | 0 | 0 | 0 | 2 | 2 | 2 | 2 | 2 | 2 | |
| 0 | 0 | 0 | 0 | 0 | 0 | 0 | 1 | 2 | 2 | |
| 0 | 0 | 0 | 1 | 1 | 1 | 1 | 1 | 1 | 1 | |
| 0 | 0 | 0 | 1 | 1 | 1 | 1 | 1 | 1 | 1 | |
| 0 | 0 | 0 | 0 | 1 | 1 | 1 | 1 | 1 | 1 | |
| 0 | 0 | 0 | 0 | 1 | 1 | 1 | 1 | 1 | 1 | |
| 0 | 0 | 0 | 0 | 1 | 1 | 1 | 1 | 1 | 1 | |
| 0 | 0 | 0 | 0 | 1 | 1 | 1 | 1 | 1 | 1 | |
| 0 | 0 | 0 | 0 | 1 | 1 | 1 | 1 | 1 | 1 | |
| 0 | 0 | 0 | 0 | 0 | 0 | 0 | 0 | 0 | 1 |
--Timeshifter (talk) 03:04, 21 October 2020 (UTC)
- The above table was placed in the article. See template:
- Template:Monthly cumulative COVID-19 death totals by country
- Help is needed to make it narrower. See next talk subsection below.
- --Timeshifter (talk) 10:05, 24 October 2020 (UTC)
Narrower collapsed table
See table wikitext here: User:Timeshifter/Sandbox125
| Date | Jan 11 | Feb 1 | Mar 1 | Apr 1 | May 1 | Jun 1 | Jul 1 | Aug 1 | Sep 1 | Oct 1 |
|---|---|---|---|---|---|---|---|---|---|---|
| World | 1 | 259 | 2,977 | 40,598 | 224,172 | 371,166 | 508,055 | 675,060 | 848,445 | 1,010,639 |
| Days to double | 6 | 4 | 16 | 8 | 18 | 37 | 56 | 70 | 80 | 94 |
| Countries and territories | 1 | 1 | 8 | 125 | 175 | 185 | 186 | 192 | 191 | 193 |
| 0 | 0 | 1 | 2,850 | 55,337 | 102,640 | 126,573 | 151,265 | 182,162 | 204,642 | |
| 0 | 0 | 0 | 159 | 5,466 | 28,834 | 58,314 | 91,263 | 120,828 | 142,921 | |
| 0 | 0 | 0 | 38 | 1,147 | 5,394 | 17,400 | 36,511 | 65,288 | 98,678 | |
| 0 | 0 | 0 | 28 | 1,732 | 9,779 | 27,121 | 46,000 | 64,158 | 77,163 | |
| 0 | 0 | 0 | 1,789 | 26,771 | 38,489 | 43,730 | 46,119 | 41,501 | 42,143 | |
| 0 | 0 | 29 | 12,430 | 27,967 | 33,415 | 34,767 | 35,141 | 35,483 | 35,894 | |
| 0 | 0 | 0 | 24 | 943 | 4,371 | 9,504 | 19,021 | 28,788 | 32,396 | |
| 0 | 0 | 0 | 8,189 | 24,543 | 29,045 | 28,355 | 28,445 | 29,141 | 31,791 | |
| 0 | 0 | 2 | 3,514 | 24,342 | 28,746 | 29,760 | 30,147 | 30,494 | 31,746 | |
| 0 | 0 | 43 | 2,898 | 6,028 | 7,797 | 10,817 | 16,766 | 21,571 | 26,169 | |
| 0 | 0 | 0 | 14 | 278 | 890 | 3,223 | 9,810 | 19,364 | 25,828 | |
| 0 | 0 | 0 | 17 | 1,169 | 4,855 | 9,536 | 14,058 | 17,299 | 20,891 | |
| 0 | 0 | 0 | 5 | 103 | 683 | 2,657 | 8,005 | 14,149 | 16,734 | |
| 0 | 0 | 0 | 24 | 215 | 530 | 1,283 | 3,466 | 8,498 | 16,519 | |
| 0 | 0 | 0 | 12 | 227 | 1,054 | 5,688 | 9,457 | 11,289 | 12,741 | |
| 0 | 0 | 0 | 75 | 900 | 3,358 | 4,527 | 5,702 | 6,556 | 11,355 | |
| 0 | 0 | 0 | 136 | 792 | 1,613 | 2,876 | 5,131 | 7,417 | 10,740 | |
| 0 | 0 | 0 | 705 | 7,594 | 9,467 | 9,754 | 9,841 | 9,897 | 10,020 | |
| 0 | 0 | 0 | 732 | 6,288 | 8,511 | 8,985 | 9,148 | 9,302 | 9,500 | |
| 0 | 0 | 0 | 89 | 3,082 | 7,092 | 8,566 | 8,929 | 9,117 | 9,291 | |
| 0 | 0 | 0 | 50 | 93 | 205 | 1,943 | 4,741 | 7,042 | 9,181 | |
| 0 | 0 | 0 | 214 | 3,174 | 4,540 | 5,131 | 5,691 | 6,370 | 8,195 | |
| 0 | 0 | 0 | 6 | 59 | 310 | 1,071 | 2,894 | 4,966 | 7,931 | |
| 0 | 0 | 0 | 26 | 385 | 1,543 | 4,395 | 5,951 | 6,298 | 6,479 | |
| 0 | 0 | 0 | 1,039 | 4,795 | 5,956 | 6,113 | 6,147 | 6,215 | 6,397 | |
| 0 | 0 | 0 | 46 | 392 | 959 | 2,953 | 4,805 | 5,421 | 5,914 | |
| 0 | 0 | 0 | 180 | 2,586 | 4,395 | 5,333 | 5,743 | 5,820 | 5,893 | |
| 0 | 0 | 1 | 88 | 568 | 957 | 1,266 | 2,023 | 3,558 | 5,504 | |
| 0 | 0 | 0 | 6 | 168 | 650 | 1,847 | 3,111 | 4,281 | 5,251 | |
| 0 | 0 | 0 | 69 | 717 | 1,262 | 1,651 | 2,343 | 3,621 | 4,825 | |
| 0 | 0 | 0 | 10 | 162 | 503 | 1,649 | 2,866 | 3,897 | 4,768 | |
| 1 | 259 | 2,873 | 3,321 | 4,643 | 4,645 | 4,648 | 4,668 | 4,730 | 4,746 | |
| 0 | 0 | 0 | 17 | 272 | 718 | 1,173 | 1,709 | 2,605 | 4,193 | |
| 0 | 0 | 0 | 1 | 16 | 102 | 746 | 1,924 | 2,760 | 3,246 | |
| 0 | 0 | 0 | 33 | 644 | 1,064 | 1,463 | 1,716 | 2,039 | 2,513 | |
| 0 | 0 | 0 | 24 | 178 | 330 | 620 | 1,397 | 1,995 | 2,364 | |
| 0 | 0 | 0 | 2 | 71 | 201 | 485 | 1,312 | 1,858 | 2,323 | |
| 0 | 0 | 0 | 36 | 170 | 205 | 228 | 353 | 1,141 | 2,152 | |
| 0 | 0 | 0 | 51 | 301 | 502 | 747 | 1,160 | 1,710 | 2,105 | |
| 0 | 0 | 0 | 2 | 25 | 41 | 188 | 793 | 1,878 | 2,075 | |
| 0 | 0 | 0 | 160 | 989 | 1,410 | 1,576 | 1,735 | 1,822 | 1,971 | |
| 0 | 0 | 0 | 71 | 1,232 | 1,652 | 1,736 | 1,763 | 1,777 | 1,804 | |
| 0 | 0 | 0 | 373 | 1,422 | 1,656 | 1,683 | 1,703 | 1,725 | 1,782 | |
| 0 | 0 | 0 | 35 | 450 | 653 | 912 | 1,210 | 1,510 | 1,736 | |
| 0 | 0 | 5 | 57 | 432 | 892 | 974 | 1,011 | 1,296 | 1,571 | |
| 0 | 0 | 0 | 21 | 223 | 285 | 319 | 493 | 961 | 1,543 | |
| 0 | 0 | 0 | 4 | 64 | 265 | 774 | 1,283 | 1,406 | 1,458 | |
| 0 | 0 | 0 | 3 | 119 | 295 | 547 | 778 | 995 | 1,320 | |
| 0 | 0 | 0 | 0 | 3 | 11 | 103 | 274 | 809 | 1,198 | |
| 0 | 0 | 0 | 1 | 58 | 287 | 590 | 879 | 1,013 | 1,112 | |
| 0 | 0 | 0 | 0 | 8 | 16 | 62 | 1,397 | 1,060 | 1,065 | |
| 0 | 0 | 0 | 3 | 33 | 139 | 453 | 749 | 881 | 963 | |
| 0 | 0 | 0 | 1 | 11 | 49 | 176 | 421 | 685 | 935 | |
| 0 | 0 | 0 | 20 | 92 | 103 | 104 | 196 | 652 | 886 | |
| 0 | 0 | 0 | 2 | 6 | 10 | 15 | 140 | 418 | 880 | |
| 0 | 0 | 0 | 12 | 68 | 152 | 185 | 324 | 603 | 849 | |
| 0 | 0 | 0 | 0 | 9 | 46 | 174 | 448 | 717 | 843 | |
| 0 | 0 | 0 | 3 | 9 | 11 | 17 | 47 | 308 | 841 | |
| 0 | 0 | 0 | 2 | 31 | 286 | 572 | 746 | 823 | 836 | |
| 0 | 0 | 0 | 0 | 89 | 235 | 392 | 559 | 681 | 833 | |
| 0 | 0 | 0 | 8 | 66 | 140 | 230 | 383 | 629 | 825 | |
| 0 | 0 | 0 | 128 | 584 | 668 | 705 | 718 | 733 | 799 | |
| 0 | 0 | 0 | 16 | 323 | 526 | 585 | 596 | 615 | 781 | |
| 0 | 0 | 0 | 13 | 179 | 243 | 277 | 573 | 713 | 749 | |
| 0 | 0 | 0 | 9 | 77 | 133 | 302 | 486 | 603 | 739 | |
| 0 | 0 | 0 | 1 | 17 | 64 | 148 | 341 | 577 | 711 | |
| 0 | 0 | 0 | 8 | 54 | 136 | 153 | 219 | 434 | 661 | |
| 0 | 0 | 0 | 31 | 236 | 320 | 349 | 382 | 424 | 655 | |
| 0 | 0 | 0 | 90 | 452 | 574 | 605 | 615 | 624 | 650 | |
| 0 | 0 | 0 | 3 | 10 | 14 | 48 | 158 | 381 | 621 | |
| 0 | 0 | 0 | 1 | 22 | 30 | 41 | 217 | 515 | 615 | |
| 0 | 0 | 0 | 0 | 26 | 212 | 354 | 447 | 531 | 610 | |
| 0 | 0 | 0 | 5 | 24 | 63 | 213 | 448 | 534 | 591 | |
| 0 | 0 | 0 | 0 | 2 | 81 | 313 | 494 | 567 | 588 | |
| 0 | 0 | 0 | 0 | 3 | 5 | 24 | 74 | 237 | 551 | |
| 0 | 0 | 0 | 0 | 0 | 8 | 29 | 56 | 228 | 498 | |
| 0 | 0 | 0 | 2 | 9 | 15 | 26 | 143 | 322 | 471 | |
| 0 | 0 | 0 | 6 | 61 | 191 | 313 | 391 | 414 | 418 | |
| 0 | 0 | 0 | 6 | 105 | 264 | 315 | 351 | 384 | 416 | |
| 0 | 0 | 18 | 165 | 248 | 271 | 282 | 301 | 324 | 415 | |
| 0 | 0 | 0 | 49 | 140 | 175 | 192 | 206 | 266 | 391 | |
| 0 | 0 | 0 | 13 | 31 | 33 | 65 | 157 | 284 | 387 | |
| 0 | 0 | 0 | 1 | 2 | 5 | 11 | 85 | 173 | 368 | |
| 0 | 0 | 0 | 12 | 24 | 27 | 34 | 59 | 167 | 361 | |
| 0 | 0 | 0 | 17 | 211 | 320 | 328 | 329 | 335 | 344 | |
| 0 | 0 | 0 | 0 | 3 | 7 | 24 | 151 | 288 | 332 | |
| 0 | 0 | 0 | 0 | 9 | 42 | 112 | 205 | 284 | 311 | |
| 0 | 0 | 0 | 1 | 6 | 6 | 6 | 6 | 6 | 310 | |
| 0 | 0 | 0 | 5 | 17 | 36 | 112 | 182 | 276 | 301 | |
| 0 | 0 | 0 | 6 | 69 | 103 | 107 | 145 | 186 | 280 | |
| 0 | 0 | 0 | 28 | 204 | 236 | 250 | 255 | 264 | 274 | |
| 0 | 0 | 0 | 8 | 31 | 71 | 169 | 214 | 258 | 272 | |
| 0 | 0 | 0 | 4 | 8 | 19 | 87 | 148 | 190 | 246 | |
| 0 | 0 | 0 | 10 | 41 | 48 | 50 | 50 | 77 | 246 | |
| 0 | 0 | 0 | 0 | 0 | 6 | 20 | 106 | 192 | 230 | |
| 0 | 0 | 0 | 0 | 7 | 41 | 105 | 161 | 201 | 229 | |
| 0 | 0 | 0 | 1 | 4 | 4 | 7 | 67 | 202 | 228 | |
| 0 | 0 | 0 | 2 | 10 | 38 | 113 | 174 | 197 | 214 | |
| 0 | 0 | 0 | 2 | 3 | 5 | 9 | 43 | 112 | 197 | |
| 0 | 0 | 0 | 2 | 2 | 4 | 13 | 51 | 108 | 183 | |
| 0 | 0 | 0 | 0 | 3 | 4 | 16 | 114 | 175 | 179 | |
| 0 | 0 | 0 | 2 | 7 | 9 | 12 | 49 | 100 | 170 | |
| 0 | 0 | 0 | 0 | 1 | 23 | 128 | 157 | 159 | 161 | |
| 0 | 0 | 0 | 1 | 4 | 35 | 74 | 116 | 137 | 151 | |
| 0 | 0 | 0 | 13 | 91 | 108 | 111 | 117 | 128 | 138 | |
| 0 | 0 | 0 | 43 | 102 | 115 | 121 | 125 | 127 | 136 | |
| 0 | 0 | 0 | 0 | 26 | 77 | 116 | 124 | 126 | 131 | |
| 0 | 0 | 0 | 23 | 90 | 110 | 110 | 114 | 124 | 124 | |
| 0 | 0 | 0 | 6 | 61 | 83 | 86 | 87 | 94 | 122 | |
| 0 | 0 | 0 | 0 | 0 | 0 | 0 | 10 | 75 | 121 | |
| 0 | 0 | 0 | 0 | 14 | 33 | 66 | 102 | 115 | 120 | |
| 0 | 0 | 0 | 1 | 1 | 1 | 2 | 9 | 96 | 112 | |
| 0 | 0 | 0 | 0 | 1 | 2 | 11 | 40 | 91 | 109 | |
| 0 | 0 | 0 | 1 | 7 | 9 | 10 | 10 | 21 | 107 | |
| 0 | 0 | 0 | 0 | 1 | 1 | 13 | 26 | 67 | 104 | |
| 0 | 0 | 0 | 0 | 28 | 78 | 90 | 93 | 98 | 99 | |
| 0 | 0 | 0 | 0 | 11 | 11 | 11 | 14 | 43 | 95 | |
| 0 | 0 | 0 | 7 | 45 | 70 | 78 | 80 | 86 | 92 | |
| 0 | 0 | 0 | 0 | 9 | 20 | 41 | 56 | 78 | 89 | |
| 0 | 0 | 0 | 0 | 3 | 65 | 74 | 75 | 77 | 85 | |
| 0 | 0 | 0 | 0 | 2 | 12 | 12 | 83 | 83 | 83 | |
| 0 | 0 | 0 | 0 | 16 | 27 | 36 | 75 | 82 | 82 | |
| 0 | 0 | 0 | 2 | 8 | 12 | 12 | 20 | 37 | 78 | |
| 0 | 0 | 0 | 0 | 0 | 47 | 52 | 60 | 68 | 76 | |
| 0 | 0 | 0 | 3 | 8 | 8 | 8 | 8 | 22 | 75 | |
| 0 | 0 | 0 | 0 | 0 | 0 | 0 | 3 | 32 | 75 | |
| 0 | 0 | 0 | 0 | 7 | 46 | 60 | 67 | 70 | 72 | |
| 0 | 0 | 0 | 3 | 32 | 64 | 67 | 69 | 69 | 69 | |
| 0 | 0 | 0 | 0 | 7 | 23 | 33 | 46 | 59 | 66 | |
| 0 | 0 | 0 | 0 | 1 | 1 | 15 | 43 | 59 | 66 | |
| 0 | 0 | 0 | 4 | 52 | 68 | 69 | 69 | 64 | 64 | |
| 0 | 0 | 0 | 0 | 0 | 2 | 47 | 59 | 62 | 62 | |
| 0 | 0 | 0 | 5 | 8 | 9 | 9 | 11 | 15 | 61 | |
| 0 | 0 | 0 | 0 | 2 | 24 | 54 | 58 | 60 | 61 | |
| 0 | 0 | 0 | 0 | 0 | 2 | 6 | 11 | 23 | 61 | |
| 0 | 0 | 0 | 1 | 1 | 4 | 15 | 23 | 40 | 60 | |
| 0 | 0 | 0 | 12 | 54 | 57 | 58 | 58 | 58 | 59 | |
| 0 | 0 | 0 | 14 | 43 | 53 | 53 | 53 | 55 | 57 | |
| 0 | 0 | 0 | 5 | 12 | 14 | 14 | 14 | 16 | 57 | |
| 0 | 0 | 0 | 1 | 3 | 17 | 42 | 49 | 53 | 54 | |
| 0 | 0 | 0 | 12 | 42 | 51 | 52 | 66 | 53 | 53 | |
| 0 | 0 | 0 | 2 | 5 | 5 | 5 | 5 | 10 | 49 | |
| 0 | 0 | 0 | 0 | 0 | 10 | 38 | 46 | 47 | 49 | |
| 0 | 0 | 0 | 1 | 9 | 13 | 14 | 18 | 27 | 48 | |
| 0 | 0 | 0 | 1 | 15 | 22 | 27 | 35 | 44 | 48 | |
| 0 | 0 | 0 | 0 | 23 | 28 | 28 | 29 | 33 | 48 | |
| 0 | 0 | 0 | 26 | 41 | 42 | 42 | 42 | 42 | 42 | |
| 0 | 0 | 0 | 0 | 4 | 23 | 35 | 39 | 40 | 42 | |
| 0 | 0 | 0 | 0 | 2 | 3 | 21 | 36 | 40 | 41 | |
| 0 | 0 | 0 | 0 | 6 | 12 | 15 | 17 | 19 | 40 | |
| 0 | 0 | 0 | 0 | 1 | 8 | 24 | 27 | 33 | 39 | |
| 0 | 0 | 0 | 0 | 15 | 24 | 30 | 32 | 34 | 37 | |
| 0 | 0 | 0 | 0 | 0 | 0 | 0 | 13 | 31 | 36 | |
| 0 | 0 | 0 | 0 | 0 | 0 | 0 | 2 | 34 | 35 | |
| 0 | 0 | 0 | 0 | 4 | 7 | 9 | 9 | 12 | 34 | |
| 0 | 0 | 0 | 0 | 0 | 5 | 8 | 16 | 28 | 34 | |
| 0 | 0 | 0 | 2 | 20 | 29 | 31 | 31 | 32 | 32 | |
| 0 | 0 | 0 | 0 | 0 | 1 | 2 | 5 | 16 | 29 | |
| 0 | 0 | 0 | 3 | 15 | 23 | 26 | 27 | 27 | 27 | |
| 0 | 0 | 0 | 0 | 2 | 2 | 2 | 2 | 13 | 26 | |
| 0 | 0 | 0 | 0 | 2 | 3 | 3 | 3 | 10 | 26 | |
| 0 | 0 | 0 | 1 | 19 | 22 | 22 | 22 | 22 | 25 | |
| 0 | 0 | 0 | 0 | 22 | 24 | 24 | 24 | 24 | 24 | |
| 0 | 0 | 0 | 8 | 20 | 17 | 19 | 19 | 21 | 22 | |
| 0 | 0 | 0 | 0 | 13 | 15 | 15 | 15 | 17 | 22 | |
| 0 | 0 | 0 | 2 | 14 | 14 | 14 | 15 | 16 | 21 | |
| 0 | 0 | 0 | 1 | 17 | 21 | 21 | 21 | 21 | 21 | |
| 0 | 0 | 0 | 0 | 4 | 6 | 6 | 8 | 14 | 20 | |
| 0 | 0 | 0 | 0 | 1 | 1 | 1 | 2 | 6 | 16 | |
| 0 | 0 | 0 | 0 | 0 | 1 | 2 | 4 | 5 | 16 | |
| 0 | 0 | 0 | 0 | 1 | 10 | 11 | 15 | 15 | 15 | |
| Other | 0 | 0 | 6 | 7 | 13 | 13 | 13 | 13 | 13 | 13 |
| 0 | 0 | 0 | 2 | 7 | 10 | 11 | 11 | 12 | 13 | |
| 0 | 0 | 0 | 1 | 13 | 13 | 13 | 13 | 13 | 13 | |
| 0 | 0 | 0 | 2 | 10 | 10 | 10 | 10 | 10 | 10 | |
| 0 | 0 | 0 | 5 | 10 | 10 | 10 | 10 | 10 | 10 | |
| 0 | 0 | 0 | 0 | 6 | 9 | 9 | 9 | 9 | 9 | |
| 0 | 0 | 0 | 2 | 3 | 3 | 3 | 3 | 5 | 8 | |
| 0 | 0 | 0 | 0 | 7 | 7 | 7 | 7 | 7 | 7 | |
| 0 | 0 | 0 | 0 | 0 | 2 | 7 | 7 | 7 | 7 | |
| 0 | 0 | 0 | 0 | 0 | 0 | 0 | 2 | 5 | 7 | |
| 0 | 0 | 0 | 0 | 0 | 0 | 0 | 0 | 0 | 7 | |
| 0 | 0 | 0 | 0 | 1 | 1 | 2 | 2 | 3 | 6 | |
| 0 | 0 | 0 | 1 | 1 | 2 | 3 | 3 | 3 | 3 | |
| 0 | 0 | 0 | 0 | 3 | 3 | 3 | 3 | 3 | 3 | |
| 0 | 0 | 0 | 0 | 2 | 2 | 2 | 2 | 2 | 2 | |
| 0 | 0 | 0 | 0 | 0 | 0 | 0 | 1 | 2 | 2 | |
| 0 | 0 | 0 | 1 | 1 | 1 | 1 | 1 | 1 | 1 | |
| 0 | 0 | 0 | 1 | 1 | 1 | 1 | 1 | 1 | 1 | |
| 0 | 0 | 0 | 0 | 1 | 1 | 1 | 1 | 1 | 1 | |
| 0 | 0 | 0 | 0 | 1 | 1 | 1 | 1 | 1 | 1 | |
| 0 | 0 | 0 | 0 | 1 | 1 | 1 | 1 | 1 | 1 | |
| 0 | 0 | 0 | 0 | 1 | 1 | 1 | 1 | 1 | 1 | |
| 0 | 0 | 0 | 0 | 1 | 1 | 1 | 1 | 1 | 1 | |
| 0 | 0 | 0 | 0 | 0 | 0 | 0 | 0 | 0 | 1 |
Bawolff, AHollender (WMF), Jc86035, Wikmoz etc..
class=covid-sticky only seems to work on one header row. It also needs to work on the sorting row. It is also a header row. But for some reason the code does not make it sticky. Scroll the table down to see what I mean. The sorting row disappears. The date row remains.
Can this be fixed in the template CSS?
Or can some other CSS code be created?: Maybe: class=covid-sticky2 --Timeshifter (talk) 03:02, 21 October 2020 (UTC)
- I also asked for help here:
- Wikipedia talk:TemplateStyles
- I pointed them to this discussion.
- --Timeshifter (talk) 07:20, 27 October 2020 (UTC)
- I didn't find a technical solution, but I noted that the "1" in every column is redundant to the "start of the month" above the table. If you remove all of them and let the sort icon be next to the month the table is almost as compact as it is now. January will need some footnote - or change the number to reflect Jan 1. Permanent link to this variant. --mfb (talk) 14:38, 27 October 2020 (UTC)
- Mfb. Great idea! Thanks. I implemented your idea here:
- Template:Monthly cumulative COVID-19 death totals by country
- --Timeshifter (talk) 15:14, 27 October 2020 (UTC)
- I didn't find a technical solution, but I noted that the "1" in every column is redundant to the "start of the month" above the table. If you remove all of them and let the sort icon be next to the month the table is almost as compact as it is now. January will need some footnote - or change the number to reflect Jan 1. Permanent link to this variant. --mfb (talk) 14:38, 27 October 2020 (UTC)
Problems solved
See discussion and solutions to various problems with these templates:
--Timeshifter (talk) 03:57, 29 October 2020 (UTC)
Centered vs. Right Floating Images
The right floating images seem to be ideal for desktop and automatically stack in mobile view. Also fits with the norm of left-aligning most body content. I'm not sure I understand the benefit to mobile users by stacking content on desktop as well. Moxy, are the images not stacking for you on your mobile device? - Wikmoz (talk) 01:13, 4 November 2020 (UTC)
- Stacking depends on screen size....so for many there is a huge white space taking up 3/4 of the screen that should simply be occupied by a bigger image that is legible. Why half size images on the right when no prose text. Images is the information in these cases so why not have them the same size as the data charts so they are just as legible. Data in the pictures are just as important as the data in the charts. Conformity and neutrality in presentation should be a goal here be it with hard coded charts or by way of charts in image.--Moxy 🍁 01:50, 4 November 2020 (UTC)
By continent maps -Europe
Hi- I notice that the Europe map in the "by continent" section is of a different form to every other map (cases per 100,000 rather than total number of cases). Anyone have a more consistent map they can exchange for it? Cheers, Grutness...wha? 12:06, 10 November 2020 (UTC)
Antarctica
Should the continent be included in the list? — Preceding unsigned comment added by 195.244.210.117 (talk) 07:08, 29 October 2020 (UTC)
- It's a continent, it's got people in it, and the fact that it's the only one with no cases is significant. So yes. Grutness...wha? 12:07, 10 November 2020 (UTC)
Recoveries
Why does the table say "no data" in Jordan and Slovenia recoveries? Both countries are still reporting recoveries. Chopanero77 (talk) 01:08, 12 November 2020 (UTC)
Georgia Past 100,000
Georgia (the country bordering Russia, not the American state) has passed 100,000 cases. Change its color on the world map. — Preceding unsigned comment added by 2600:1700:82E0:A690:59D1:A659:6A4:248F (talk) 09:07, 24 November 2020 (UTC)
Semi-protected edit request on 13 December 2020
This edit request to COVID-19 pandemic by country and territory has been answered. Set the |answered= or |ans= parameter to no to reactivate your request. |
Can you add more countries? 2601:205:C002:D1E0:2113:140F:28DD:47F5 (talk) 22:48, 13 December 2020 (UTC)
 Not done: it's not clear what changes you want to be made. Please mention the specific changes in a "change X to Y" format and provide a reliable source if appropriate. Please be specific about what you want added, along with citations to reliable sources. RudolfRed (talk) 23:20, 13 December 2020 (UTC)
Cumulative monthly death totals by country
This section requires an update for Dec 1. — Preceding unsigned comment added by 50.67.13.101 (talk) 04:37, 8 December 2020 (UTC)
- Still nothing on this? — Preceding unsigned comment added by 50.67.13.101 (talk) 06:28, 17 December 2020 (UTC)
- I updated the monthly table through Dec 1, 2020. For more info see:
- Template talk:Monthly cumulative COVID-19 death totals by country.
- --Timeshifter (talk) 12:54, 18 December 2020 (UTC)
Map in the infobox
Like in the main article, I would argue the map in the infobox should be replaced with the one showing the deaths per capita. We have even put a disclaimer in one of the case maps that it isn't a comparable statistic, so putting it in map form in the infobox is probably misleading. Same for the continent breakdown. --Antondimak (talk) 08:14, 30 November 2020 (UTC)
- I would argue to put back the map of the reported cases per capita to infobox. Now that the map is no longer accessible from the page, those who are interested in that map lost the possibility to view it. The map showing the deaths per capita isn't a comparable statistic either. It is highly dependent on a country's healthcare system. Besides now the deaths per capita map is present twice on the page while the confirmed cases per capita is no longer there. -- Apple1415 (talk) 11:13, 2 December 2020 (UTC)
- Then we should put the cases per capita somewhere else on the article. The deaths per capita statistic also isn't comparable, but it's much more so than the cases per capita one, which is dependent on the testing strategy. I'm not sure what you mean when you say that "it's highly dependent on a country's healthcare system". --Antondimak (talk) 12:13, 2 December 2020 (UTC)
A non-per capita statistic is even more misleading to put on a map. As such, the cases by country map would be misleading even if the cases were a reliable and comparable statistic, which they aren't. Therefore I'm proposing also replacing the cases map in the first section with the cases per capita map currently in the infobox, also addressing a concern that the cases per capita map wouldn't be easily available after the replacement in the infobox. --Antondimak (talk) 07:53, 4 December 2020 (UTC)
I'm implementating the proposal since there's no opposition. --Antondimak (talk) 22:57, 5 December 2020 (UTC)
- Antondimak, the topic of this article is COVID-19 pandemic, not deaths caused by COVID-19, so there should be the map of the reported cases. Uge Rondo (talk) 13:04, 6 December 2020 (UTC)
- The topic of this article is the COVID-19 pandemic, not the amount of confirmed cases of the virus. The death statistic reflects the actual spread of the pandemic better than the confirmed cases. --Antondimak (talk) 14:01, 6 December 2020 (UTC)
- Antondimak the map at the top of the article should be updated more frequently. The map which was being used before was being updated every day or two. Sladnick (talk) 16:35, 16 December 2020 (UTC)
- I too wish that would be done. There was an automatic script made for updating it, but I can't make it work (I know little about Python). I asked for help in the map's talk page, with no answer. I have been manually updating it by editing the source file as a text, which is quite tedious and can't be done that often. --Antondimak (talk) 16:40, 16 December 2020 (UTC)
- Antondimak I do not have a preference for either map based on its merits, but if the deaths map cannot be updated regularly then we really should revert to the cases map at the top of the article, at least until you can figure out how to work the script. Sladnick (talk) 17:02, 17 December 2020 (UTC)
- I'm looking into it. --Antondimak (talk) 14:50, 18 December 2020 (UTC)
- Antondimak I do not have a preference for either map based on its merits, but if the deaths map cannot be updated regularly then we really should revert to the cases map at the top of the article, at least until you can figure out how to work the script. Sladnick (talk) 17:02, 17 December 2020 (UTC)
- I too wish that would be done. There was an automatic script made for updating it, but I can't make it work (I know little about Python). I asked for help in the map's talk page, with no answer. I have been manually updating it by editing the source file as a text, which is quite tedious and can't be done that often. --Antondimak (talk) 16:40, 16 December 2020 (UTC)
- Antondimak the map at the top of the article should be updated more frequently. The map which was being used before was being updated every day or two. Sladnick (talk) 16:35, 16 December 2020 (UTC)
- The topic of this article is the COVID-19 pandemic, not the amount of confirmed cases of the virus. The death statistic reflects the actual spread of the pandemic better than the confirmed cases. --Antondimak (talk) 14:01, 6 December 2020 (UTC)
Typos in numbers and outdated numbers for less-hit countries in the first table
I understand that maintaining this table on a regular basis is plenty of work, so it may not be possible to check every single country every single day. But I'm going to mention a few examples which have caught my attention during the last week:
Today's total death toll for Germany is off by an order of magnitude. Yesterday the figure was around 26000-27000, today it is over 270000. That must be a typo.
For some of the countries with low (official) incidence, there is more recent data in the respective articles than in the table, which means that there are newer official numbers but they haven't been written into the table for a while. One example is Eritrea, which has 807 recognized Covid-19 cases according to COVID-19 pandemic in Eritrea, but the table still states 491. Papua New Guinea also has newer numbers in its article. There are probably more examples, but right now I can't remember any.
--2003:E7:772E:5A16:C1D8:FDF:2E8:E8ED (talk) 23:27, 22 December 2020 (UTC)
China
I do not want to go into conspiracy theories, but I am having a VERY hard time, purely from a statistical point of view alone, believing the numbers from China. Such a big country and so few cases? That is strange. People need to ask what's up there really. For Wikipedia, they should perhaps not engage in queries (we want objective, and verifiable facts), but in the long run I think that number has to be more critically evaluated since it stands out too sharply right now. 2A02:8388:1602:6D80:C8A5:16D:2619:C668 (talk) 19:09, 9 December 2020 (UTC)
The number of confirmed cases for China in table "Total cases and deaths" (86,741)
differs from the one in "Total cases and death rates by country" (94,328). The latter table doesn't contain Hong Kong and Macau, so maybe they are computed in China? If the numbers differ intentionally, this should be explained.
94.222.248.85 (talk) 21:30, 14 December 2020 (UTC)
- See the explanation in the 'Total cases and death rates by country' table: "Cases and death rates are as reported by the Johns Hopkins University Coronavirus Resource Center. The figures may differ from those in the 'Total cases and deaths' table above, which are based on a variety of sources." This table is based on the John Hopkins table at [1]. The figure in 'Total cases and deaths' is based on the National Health Commission of China. Dudley Miles (talk) 21:45, 14 December 2020 (UTC)
The death total for China has remained essentially unchanged since June or July. I stopped looking at it months ago. Move along folks -- nothing to see here. 70.51.88.153 (talk) 06:05, 23 December 2020 (UTC)
CAUTION - Data in Historical versions of This Article may be INCORRECT
CAUTION ... Be very careful using historical versions of this article ... the data may not be correct for the date of the historical version. For example, the "COVID-19 pandemic by location" table in the Statistics section utilizes a template Template:COVID-19 pandemic data so that the data shown in this table in a historical version of the article is the latest (i.e.-current) data, not the data at the date of the historical version. If you want the historical data, please open the historical version of the template for the date you're interested in. Truthanado (talk) 19:10, 23 December 2020 (UTC)
Highlighting Antarctica in the world maps.
Greetings everyone!
Wouldn't Antarctica be updated in all the world maps in the page and be highlighted based on the colors (light red as it's 58 cases) since it's now been confirmed that they tho has the virus? I would do it, but I don't know how to do that.
Heytherejames (talk) 11:41, 24 December 2020 (UTC)
Germany
The death total for Germany is too big by a factor of 10. Please fix. 70.51.88.153 (talk) 06:04, 23 December 2020 (UTC)
- Was fixed here. --mfb (talk) 03:09, 25 December 2020 (UTC)
Semi-protected edit request on 3 January 2021
This edit request to COVID-19 pandemic by country and territory has been answered. Set the |answered= or |ans= parameter to no to reactivate your request. |
Please remove
The only cas was an American
and add
The only case was an American
2601:5C6:8081:35C0:A526:D025:B001:AC15 (talk) 12:53, 3 January 2021 (UTC)
 Done DarthFlappy 13:29, 3 January 2021 (UTC)
2020 and 2021 tables for cumulative monthly death totals by country
See the 2020 and 2021 tables in this section:
See discussion in the 2021 talk section of this template discussion page:
- Template talk:Monthly cumulative COVID-19 death totals by country.
Data for the 2020 and 2021 templates is copied from here:
--Timeshifter (talk) 22:31, 3 January 2021 (UTC)
This table cannot be accurate. The death rate is not just the division of current deaths by current cases. The number is supposed to represent the deaths among those who were infected and/or tested positive. These deaths occur several weeks after infection and symptoms. So, the death rate for a country in the table should be based on that country's national statistic published by an official agency. At worst, the death rate can be approximated by dividing current deaths by the number of cases as many weeks ago as is the average time for deaths to occur in the respective country. ♆ CUSH ♆ 02:29, 27 December 2020 (UTC)
- You make a valid point in that deaths occur weeks after infection. However, as the pandemic continues, the number of those future deaths are statistically offset by the number of individuals who test positive in the future. Therefore, dividing deaths by total cases is the accepted calculation of death rate. Truthanado (talk) 18:46, 29 December 2020 (UTC)
- What you are referring to is the Case fatality rate which is a different measure. Chris55 (talk) 17:55, 4 January 2021 (UTC)
Progress of Vaccinations
Could a new table be created showing the progress of the number of vaccinations being administered by country? — Preceding unsigned comment added by 195.244.210.117 (talk) 09:47, 4 January 2021 (UTC)
- See discussion here:
- Talk:COVID-19 vaccine#COVID-19 vaccination chart
- --Timeshifter (talk) 21:16, 4 January 2021 (UTC)
North Korea and Turkmenistan
These two countries are listed among those who don't have COVID-19, however it is pretty clear that they simply lie.
Several news articles claim that COVID-19 reached there. Even from the actions their authorities it is pretty clear that virus is there.
Both North Korea and Turkmenistan are rather infamous liars, known to frequently lie before about variety of other things.
Yet instead of telling readers the truth we list them with those who do not have a virus and only leave a small footnote that 'Cases are suspected.'
I think we should put them in a special category "Countries that have COVID-19 despite no cases been officially reported."
Alternatively we can list them like Tanzania, with 'no data' in number of cases. And leave a footnote there that government claims there are no cases but independent journalists confirmed that COVID is present there.
That would be much closer to truth than current situation. — Preceding unsigned comment added by 49.197.220.18 (talk) 14:29, 5 January 2021 (UTC)
- No positive test, no case. As long as neither the government nor any independent entity confirms a COVID-19 case in - or coming from - these countries, there are no official cases. And try to find someone who travels out of North Korea into another country and allows him/herself to get tested... It probably won't happen. There's only a chance if COVID ravages one of these countries so hard that the government decides to seek international help.
- There have been similar discussions about the conspicuous lack of new cases and deaths in China already. --91.15.31.233 (talk) 22:40, 5 January 2021 (UTC)
- That is why we should list them as a special case rather than countries with no COVID-19. There were news articles that stated that cases are there. They locked down the entire city for three month over one suspected case https://www.nytimes.com/2020/07/25/world/asia/north-korea-coronavirus-kim-jong-un.html and then said tests were inconclusive. Here is one for Turkmenistan as well https://www.rferl.org/a/deadly-prison-outbreak-belies-turkmenistan-s-coronavirus-free-claim/30897206.html — Preceding unsigned comment added by 49.197.224.144 (talk) 09:51, 6 January 2021 (UTC)
Iceland
Why isn't Iceland included is the lists in the "Statistics" section? REDMAN 2019 (talk) 18:46, 6 January 2021 (UTC)
Date since COVID Started
Hi everyone, I think we should remove the days part off of the "date" section on the info thing. II think it's just useless and too much work to keep changing how many days it has been every day. 2601:206:8200:1C60:4951:7A78:C440:ABC5 (talk) 17:24, 28 January 2021 (UTC)
Russia
Should article have mention that Russia's deputy prime minister has revealed that Russian Covid deaths are three times the official toll? https://www.bbc.com/news/world-europe-55474028 — Preceding unsigned comment added by 85.76.5.24 (talk) 21:47, 2 February 2021 (UTC)
Number of Confirmed Cases
Hello all, I appreciate and thank all editors contributing on this hard topic. As of 2 February 2021, has the method of displaying of number of "confirmed cases" been changed or is there a mistake? It was over 100 million confirmed cases a day ago and now the top of table shows 10 million, instead. I believe figure is wrong since only USA have got over 26 million, alone. Regards. Isik (talk) 23:49, 2 February 2021 (UTC)
Recovered cases for US not updating
For what its worth, I am new to this.
The total number of recovered cases for the US hasn't changed since Jan. 30. It's been at 11166500 every day since then. Bseiger (talk) 12:02, 11 February 2021 (UTC)
Ascension Island
Ascension Island has had 4 positive cases in quarantine with the first 2 confirmed on 6 September. They have all since recovered.
https://www.ascension.gov.ac/covid-19-response-level-escalated-to-level-2-red https://www.ascension.gov.ac/covid-19-response-level-escalated-to-level-2-red-2 https://www.ascension.gov.ac/covid-19-response-level-escalated-to-level-2-red-3 Quelisal (talk) 01:00, 23 February 2021 (UTC)
U.S. Recoveries
Why does the table now say "No data" for recoveries for the U.S.? 63.248.183.81 (talk) 05:35, 27 February 2021 (UTC)
- I wasn't specific. To clarify, I'm referring to the table called "COVID-19 pandemic by location", which is the very first table in the Statistics section. 63.248.183.81 (talk) 06:11, 7 March 2021 (UTC)
- Anybody home? 63.248.183.81 (talk) 03:57, 16 March 2021 (UTC)
- I wasn't specific. To clarify, I'm referring to the table called "COVID-19 pandemic by location", which is the very first table in the Statistics section. 63.248.183.81 (talk) 06:11, 7 March 2021 (UTC)
- Not sure. You may be better off posting the question to Template talk:COVID-19 pandemic data, where the editors of that table are more active. - Wikmoz (talk) 04:46, 16 March 2021 (UTC)
- Great thank you for responding mate! Cheers! 63.248.183.81 (talk) 09:18, 16 March 2021 (UTC)
- Sorry I missed your original query. The table says no data because only some states record the number of recoveries so a total would be very misleading. John Hopkins used to show the number of recoveries in each state and and there were no figures for some of the largest states, but John Hopkins seems to have stopped showing any recovery figures presumably because they decided that they are not helpful. Dudley Miles (talk) 09:31, 16 March 2021 (UTC)
- No sweat. Thank you so much for responding and thanks for explaining. I'm not sure if I should respond here or the place Wikmoz suggested, but I'll respond to your comments here since they're here and not there. Yeah, I saw the state recoveries; there's a fair amount that don't report any like you said. I wish it were possible (is it?) to display the most recent data (incomplete, yes, but "No data" is more incomplete/misleading in my opinion; implies IMO there are no recoveries) that John Hopkins has provided? Again thanks for responding and for explaining this to me. Regards, 63.248.183.81 (talk) 04:11, 17 March 2021 (UTC)
- To clarify, I meant adding the states that have been reported to a sum total for recoveries. Is that how it was formulated before when recoveries were listed in the table or was it some other method? Thanks, 63.248.183.81 (talk) 04:14, 17 March 2021 (UTC)
- If you look at the John Hopkins summary at [2] the right hand box shows the figures for US states. If it is showing tests then you need to click on the arrow at the bottom to show number of deaths in each state. Below the deaths it used to show recoveries, but the figure for many states was blank. Recoveries are now not shown at all. It would presumably still be possible to find the number of recoveries for the states which record them and add them up but it would be a lot of work and I do not think it would serve any useful purpose. I cannot imagine that anyone seeing 'no data' for US recoveries will think that no one has recovered. Dudley Miles (talk) 09:18, 17 March 2021 (UTC)
- Okay. Thank you Dudley for explaining all of this and thank you for responding to my posts. Have a wonderful day. :)
- If you look at the John Hopkins summary at [2] the right hand box shows the figures for US states. If it is showing tests then you need to click on the arrow at the bottom to show number of deaths in each state. Below the deaths it used to show recoveries, but the figure for many states was blank. Recoveries are now not shown at all. It would presumably still be possible to find the number of recoveries for the states which record them and add them up but it would be a lot of work and I do not think it would serve any useful purpose. I cannot imagine that anyone seeing 'no data' for US recoveries will think that no one has recovered. Dudley Miles (talk) 09:18, 17 March 2021 (UTC)
- To clarify, I meant adding the states that have been reported to a sum total for recoveries. Is that how it was formulated before when recoveries were listed in the table or was it some other method? Thanks, 63.248.183.81 (talk) 04:14, 17 March 2021 (UTC)
- No sweat. Thank you so much for responding and thanks for explaining. I'm not sure if I should respond here or the place Wikmoz suggested, but I'll respond to your comments here since they're here and not there. Yeah, I saw the state recoveries; there's a fair amount that don't report any like you said. I wish it were possible (is it?) to display the most recent data (incomplete, yes, but "No data" is more incomplete/misleading in my opinion; implies IMO there are no recoveries) that John Hopkins has provided? Again thanks for responding and for explaining this to me. Regards, 63.248.183.81 (talk) 04:11, 17 March 2021 (UTC)
- Sorry I missed your original query. The table says no data because only some states record the number of recoveries so a total would be very misleading. John Hopkins used to show the number of recoveries in each state and and there were no figures for some of the largest states, but John Hopkins seems to have stopped showing any recovery figures presumably because they decided that they are not helpful. Dudley Miles (talk) 09:31, 16 March 2021 (UTC)
- Great thank you for responding mate! Cheers! 63.248.183.81 (talk) 09:18, 16 March 2021 (UTC)
63.248.183.81 (talk) 03:39, 21 March 2021 (UTC)
Top map's legend's scaling.
Re: the map at the top of the article, File:COVID-19 Outbreak World Map Total Deaths per Capita.svg
Can the numbers used be less random? Either:
- 0
- 1
- 5
- 10
- 50
- 100
- 500
- 1000
or binary?:
- 0
- 1
- 4
- 16
- 64
- 256
- 1024
It's currently 0, 1, 6, 33, 179, 1000.
Originally asked on 2021-01-13 on the image's talk page. -- Jeandré, 2021-03-20t10:41z
- It's a logarithmic scaling where every category is (1000)^1/4 = 5.6 larger than the previous one. I don't see a benefit from powers of 4, and the 1 5 10 scheme creates a lot of additional categories. There would be an argument for a bit more rounding, like 1 5 30 150, but it would have a minimal impact on the map. --mfb (talk) 03:48, 21 March 2021 (UTC)
Cumulative excess deaths
I think that for many reasons we could use a section on Cumulative Excess Deaths (mainly because they are at least arguably currently the least unreliable data for international comparisons), even tho it would require a lot of caveats, which I'm unwilling (per
Table 1 Top 10 European countries ranked by relative cumulative age-standardised excess mortality rates (%) in 2020, to 26 June (week 26) and 18 December (week 51)
Mortality rate to week 26___Mortality rate to week 51
England 7.3_____________Poland 11.6
UK 6.7_________________Spain 10.6
Spain 5.9_______________Belgium 9.7
Scotland 5.3____________Bulgaria 8.9
Belgium 3.5_____________Czech Republic 8.4
Italy 3.4________________Slovenia 8.2
Wales 2.6______________England 7.8
Sweden 2.3____________UK 7.2
Northern Ireland 2.2______Austria 5.7
Netherlands 1.9_________Scotland 5.7
Tlhslobus (talk) 17:28, 23 March 2021 (UTC)
Mexico's Numbers Should Be Revised Upwards:
Hello!
Mexico's numbers have to be revised upwards after today's announcement that they had underestimated Covid-19 deaths by perhaps around 60%. I would have done so, but I don't speak Spanish and so wouldn't be able to track down the newly revised monthly totals.
Nonetheless, here is a source for the topline figure: https://www.bbc.co.uk/news/world-latin-america-56558059 — Preceding unsigned comment added by Jacobchip (talk • contribs) 21:11, 28 March 2021 (UTC)
Semi-protected edit request on 26 April 2021
This edit request to COVID-19 pandemic by country and territory has been answered. Set the |answered= or |ans= parameter to no to reactivate your request. |
The UK COVID death figures are wrong. The figure you show is for deaths where covid symptoms were present in up to 28 days before death.
The most up to date actual source to be used is
https://www.ons.gov.uk/peoplepopulationandcommunity/birthsdeathsandmarriages/deaths/bulletins/deathsregisteredweeklyinenglandandwalesprovisional/weekending9april2021#deaths-registered-in-the-uk 46.114.89.161 (talk) 08:00, 26 April 2021 (UTC)
 Not done: This data is pulled from templates maintained elsewhere. You'll have to discuss this at Template_talk:COVID-19_pandemic_death_rates or Template_talk:COVID-19_pandemic_data ScottishFinnishRadish (talk) 11:57, 28 April 2021 (UTC)
The EU
The EU has a very detailed site on its Covid-19 situation. I'm just wondering why it it isn't being included in the data. Link: https://www.ecdc.europa.eu/en/cases-2019-ncov-eueea If there are no objections I'd like to enter the EU as an entity.Leveni (talk) 07:50, 27 April 2021 (UTC)
- It's already used as the basis of a number of tables and graphs (e.g. the regional figures) on this page and others in Wikipedia. Chris55 (talk) 20:14, 30 April 2021 (UTC)
Semi-protected edit request on 15 May 2021
This edit request to COVID-19 pandemic by country and territory has been answered. Set the |answered= or |ans= parameter to no to reactivate your request. |
change "death rate per million" to "death rate per 100k" as in the description of the corresponding graph (graph changed in the last days from one to the other) 81.221.246.232 (talk) 14:52, 15 May 2021 (UTC)
What happened to recovery number?
Did someone delete the recovery number? Could you please reinstate it? This isn’t funny anymore. It should be around 100,000 worldwide. Thank you. 95.148.142.53 (talk) 21:22, 15 May 2021 (UTC)
- Apparently, without very many people noticing, Johns Hopkins University and the WHO have stopped providing recovery numbers. I learn this from the editor who silently castrated the template which provided active cases and recovery counts to this and other articles. User:Haziq Ikhzwa deleted the detritus of the broken template on this page (twice, quite appropriately), but I don't know how we can get the other figures back (or what their source would be). Meanwhile, I'm hoping User:Z7504 will be cleaning up all articles and other templates which used the core template he silently modified. — JohnFromPinckney (talk) 22:31, 15 May 2021 (UTC)
- WHy not calculate the recovery number manually by counting the individual numbers for all countries that report recoveries? 95.148.142.53 (talk) 20:49, 16 May 2021 (UTC)
Semi-protected edit request on 21 May 2021
This edit request to COVID-19 pandemic by country and territory has been answered. Set the |answered= or |ans= parameter to no to reactivate your request. |
the data for France have not been modified for several days; moreover, the number of cases displayed is higher than that of the reference page, which is for example 5568561 on May 20 and not more than 5841129 2A01:CB14:AA2:7800:A0EA:7D66:991D:1A5 (talk) 06:51, 21 May 2021 (UTC)
- Not done: it's not clear what changes you want to be made. Please mention the specific changes in a "change X to Y" format and provide a reliable source if appropriate. ScottishFinnishRadish (talk) 11:09, 21 May 2021 (UTC)
Germany data (cases and deaths) have not been updated for several days B. Roullet — Preceding unsigned comment added by Bro52 (talk • contribs) 07:10, 22 May 2021 (UTC)
Semi-protected edit request on 22 May 2021
This edit request to COVID-19 pandemic by country and territory has been answered. Set the |answered= or |ans= parameter to no to reactivate your request. |
Germany data (cases and deaths) have not been updated for several days Bro52 (talk) 07:13, 22 May 2021 (UTC)
- Not done: it's not clear what changes you want to be made. Please mention the specific changes in a "change X to Y" format and provide a reliable source if appropriate. Bsoyka (talk · contribs) 14:56, 22 May 2021 (UTC)
Semi-protected edit request on May 22, 2021: Broken reference
This edit request to COVID-19 pandemic by country and territory has been answered. Set the |answered= or |ans= parameter to no to reactivate your request. |
This edit has produced a ref error, as it removed a reference that is cited several times elsewhere in the article. Please readd the reference to one of the cites so that the citations work again. 92.24.246.11 (talk) 14:41, 22 May 2021 (UTC)
- Done Pahunkat (talk) 14:48, 22 May 2021 (UTC)
- @Pahunkat: Ah, we meet again. Thanks once more. 92.24.246.11 (talk) 14:55, 22 May 2021 (UTC)
Dependent territories removed
Why did you remove some dependent territories from the list of territories without COVID? Hikerblunt01 (talk) 12:04, 28 May 2021 (UTC)
Inconsistent numbers for Peru
There's a huge discrepancy in the death toll for Peru between the "Total Cases and Deaths" and "Total Cases and Death Rates" charts. Which is correct, and could the incorrect numbers please be corrected? Susan Davis (talk) 14:29, 4 June 2021 (UTC)
- Yes, the deaths/100,000 is closer to 224.3. I've patched the template, but presumably someone has the wrong figure for the population of Peru, so it might happen again. Chris55 (talk) 08:14, 11 June 2021 (UTC)
Vietnam Past 10,000
Vietnam has passed 10,000 cases. Change the map color. — Preceding unsigned comment added by 2600:1700:82e0:a690:9169:64ad:3466:633a (talk • contribs) 15 June 2021 (UTC)
- I assume you are talking about this map:
- File:COVID-19 Outbreak World Map.svg
- It has just been updated. --Timeshifter (talk) 06:00, 15 June 2021 (UTC)
Our World in Data Maps?
Who copied and pasted the "Our World in Data" maps here? They suck. Change it back to the old color coded territory maps. — Preceding unsigned comment added by 2600:1700:82e0:a690:f519:a602:3a6d:e8d7 (talk • contribs) 15 June 2021 (UTC)
- Why? What's wrong with them? The Our World in Data maps are great. They are continually updated using data from the COVID-19 Data Repository by the Center for Systems Science and Engineering (CSSE) at Johns Hopkins University. --Timeshifter (talk) 08:33, 15 June 2021 (UTC)
The prior maps were Wikipedia's own work product based on its case number tabulations. The table listing case numbers for each country had the appropriate links and citations to external number sources as evidence, whether they were official government numbers or Johns Hopkins data. Deleting Wikipedia's own maps and just replacing them by pasting and relying upon another site's maps (with the other site's logo stamped on them) is inappropriate outsourcing and advertisement of an external site. If there are going to be maps based on case numbers, they should be Wikipedia's own maps. — Preceding unsigned comment added by 2600:1700:82E0:A690:3922:FA47:3672:886B (talk) 20:23, 15 June 2021 (UTC)
- Those prior maps were often out of date. It is a lot of work keeping an eye on the data coming from a couple hundred countries and territories. --Timeshifter (talk) 22:24, 15 June 2021 (UTC)
No, they were not often out of date. The maps only needed to be updated or changed color-wise whenever a certain country passed a certain numerical threshold, like 10,000, 100,000 or 1,000,000 cases, etc. That was not required often. Even if the old maps had to be updated as frequently as you suggest, resorting to external "Our World in Data" maps would not solve that problem, because somebody would have to be pasting new data maps from "our World in Data" every time the numbers/colors changed instead of changing the colors on Wikipedia's maps. — Preceding unsigned comment added by 2600:1700:82E0:A690:696D:2C18:A8AE:AD4A (talk) 01:32, 16 June 2021 (UTC)
- The Our World in Data maps look better. The color bar legend is on the map. The map image doesn't have the many small stray circles found on the other maps. Uploading a new map is easier than editing a map. --Timeshifter (talk) 02:46, 16 June 2021 (UTC)
Small stray circles? What are you talking about? Additionally, when you click on the world map, the color bar legend contained within the "Our World in Data" map contradicts the color bar legend in the Wikipedia caption.
You're going to have to change that too. Are you also going to use "Our World in Data" maps to replace the death per capita maps that are at the tops of main page and the "country and territory" page?
And the only "small stray circles" I saw on the other Wikipedia maps were there to indicate and identify small areas or jurisdictions, like really small islands or tiny countries sandwiched between larger countries. You know, like St. Helena, Fiji, Guam, Singapore, Liechtenstein, or the Vatican. The "Our World in Data" maps do not bother to account for those smaller areas. Try finding Lebanon or Macau on the "Our World in Data" map. — Preceding unsigned comment added by 2600:1700:82e0:a690:696d:2c18:a8ae:ad4a (talk) 07:59, 16 June 2021 (UTC)
- Please sign your comments. Add ~~~~ to the end of your comments.
- I started a discussion here:
- commons:File talk:COVID-19 Outbreak World Map.svg#Our World in Data maps are better
- You can see Lebanon on the Our World in Data maps. For example, see:
- https://upload.wikimedia.org/wikipedia/commons/2/26/World_map_of_total_confirmed_COVID-19_deaths_per_million_people_by_country.png
- Click the map to enlarge it to full size.
- Plus the Our World in Data source page has a table tab that lists the exact data for each country, territory, etc..
- --Timeshifter (talk) 14:04, 16 June 2021 (UTC)
Kyrgyzstan and Tajikistan Map Colors
Somebody messed up the map colors for Kyrgyzstan and Tajikistan. Kyrgyzstan has passed 100,000 cases so its color should be changed to the darker red. Meanwhile, somebody mistakenly changed Tajikistan's color to crimson red, even though its reported numbers are 13,000. Tajikistan's color should be changed back to bright red since its numbers are way below 100,000. — Preceding unsigned comment added by 2600:1700:82e0:a690:a069:9fb6:50a0:188e (talk) 22:52, 16 May 2021 (UTC)
Where Does Covid Come From
Well Wikipedia Says Its From Bats But What About a Lab? Sorry I forgot to log in -Enzotec — Preceding unsigned comment added by Enzotec (talk • contribs) 01:25, 16 June 2021 (UTC)
- This Wikipedia article says nothing about origin, so your question seems misplaced here. — JohnFromPinckney (talk / edits) 11:58, 16 June 2021 (UTC)
- Its says probaly from bats — Preceding unsigned comment added by Enzotec (talk • contribs) 14:28, 16 June 2021 (UTC)
- Please sign your comments by adding ~~~~ to the end of your comments.
- You are correct; I didn't see the small mention in the infobox. Still, I don't think the discussion of origin belongs here. I suggest you see ) 15:07, 16 June 2021 (UTC)
- Its says probaly from bats — Preceding unsigned comment added by Enzotec (talk • contribs) 14:28, 16 June 2021 (UTC)
But the chinese did not give alot of infomation only very little infomation. Are they hiding?Enzotec (talk) 01:21, 17 June 2021 (UTC)
also the link not the talk page the normal one does not show any evidence about the science — Preceding unsigned comment added by Enzotec (talk • contribs) 01:31, 17 June 2021 (UTC)
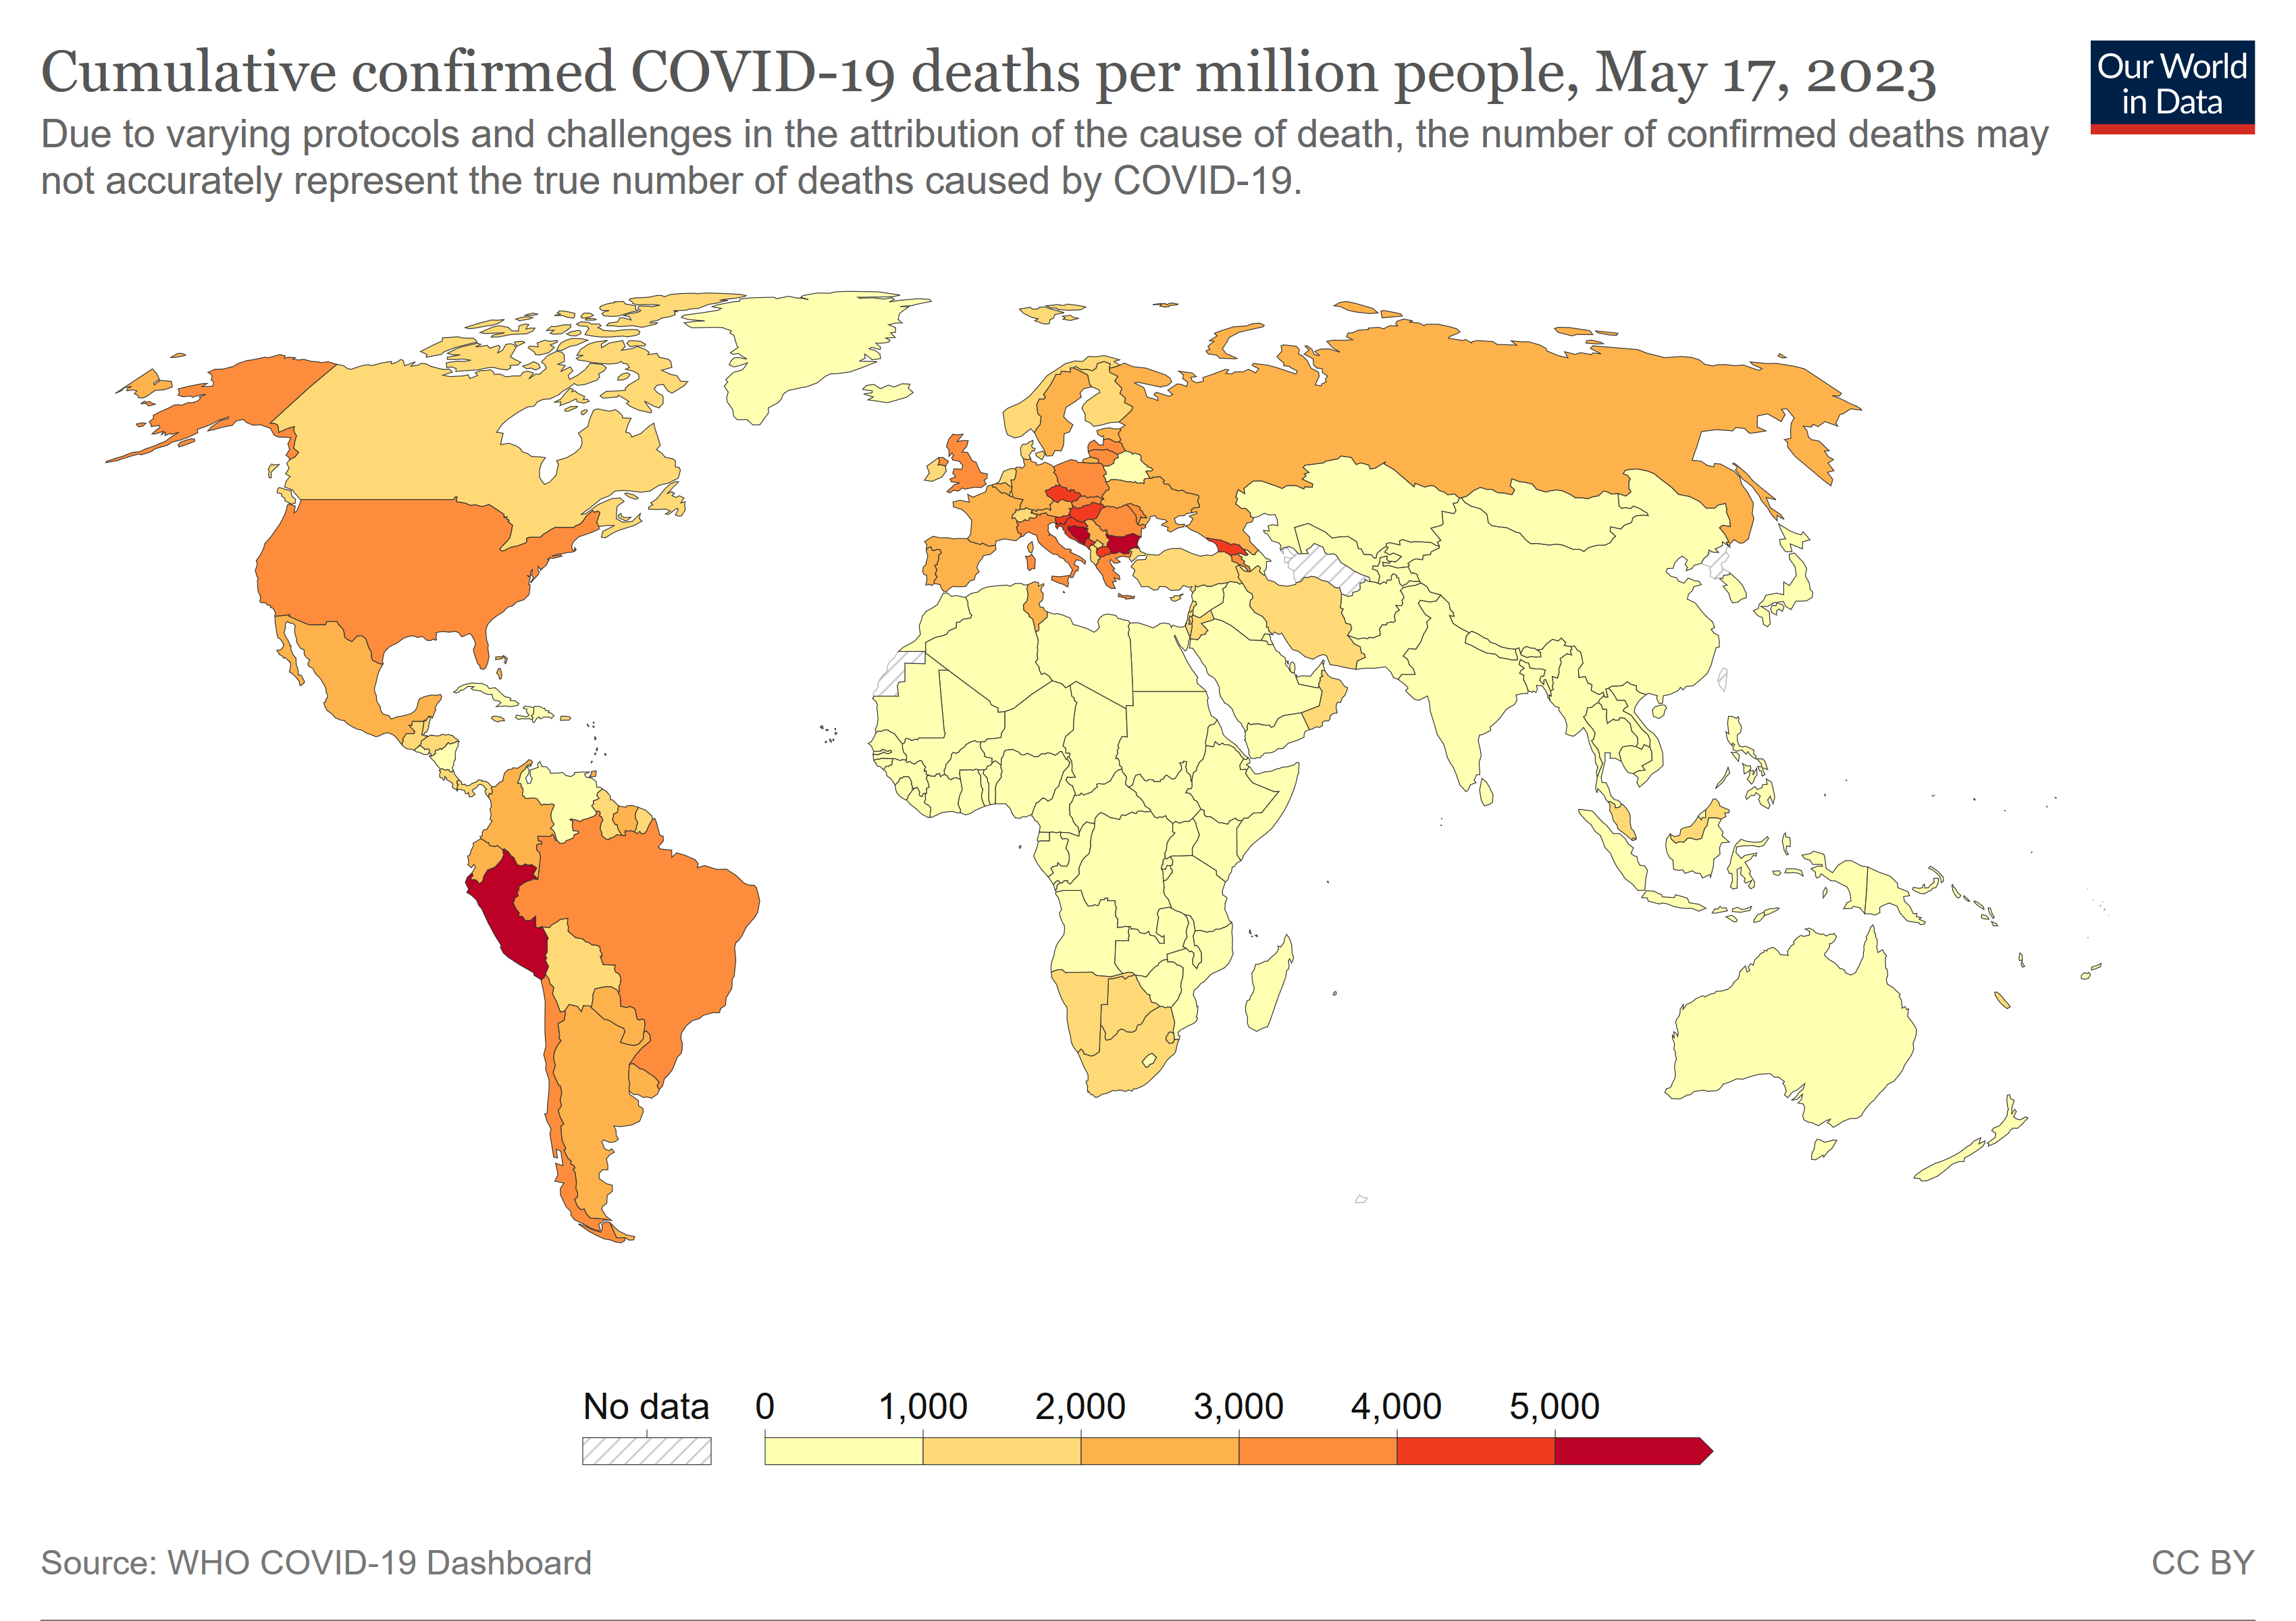
Update map?
Since File:COVID-19 Outbreak World Map Total Deaths per Capita.svg is showing statistics from over a month ago, I think it should be updated. And should the updated map include an additional darker shade for countries/territories with over e.g. 200 deaths per 100,000 population? Since there are now 15 countries that meet this criterion (with Peru at 582). If so, should Peru alone be in an even darker shade? JACKINTHEBOX • TALK 07:56, 17 June 2021 (UTC)
- By the way I'm currently updating the map (without additional colours for now). JACKINTHEBOX • TALK 13:03, 17 June 2021 (UTC)
- There is an updated map in this section here:
- COVID-19 pandemic by country and territory#Total deaths
- Here is the map:
- commons:File:World map of total confirmed COVID-19 deaths per million people by country.png
- Maybe we should put that map in the infobox.
- We could get rid of the "Total deaths" section since the map is in the infobox.
- --Timeshifter (talk) 13:25, 17 June 2021 (UTC)
- That's an idea. I will continue updating the current map in the infobox, although if it is decided the map should be replaced in the infobox, I would be fine with that too. JACKINTHEBOX • TALK 13:34, 17 June 2021 (UTC)
- JackintheBox. The source table for the other map has the rates per million by country. I believe it is updated daily.
- That may help in updating your map. Here is the link:
https://ourworldindata.org/explorers/coronavirus-data-explorer?zoomToSelection=true&pickerSort=asc&pickerMetric=location&hideControls=true&Metric=Confirmed+deaths&Interval=Cumulative&Relative+to+Population=true&Align+outbreaks=false(Oops, wrong link. See talk farther down).- If you could figure out a way to paste that column into your SVG map or script, then you (or others) could update the map once a week.
- With the visual editor one can pull out one column from a table. Or with freeware LibreOffice Calc. See Help:Table sections about the visual editor.
- --Timeshifter (talk) 14:33, 17 June 2021 (UTC)
- @Timeshifter: I've finished updating the map by entering new values and re-shading some countries/territories manually on the SVG file. For territories not included in the table under 'Total cases and death rates by country', I manually calculated their values using population data from Worldometer. But thanks anyway! JACKINTHEBOX • TALK 15:24, 17 June 2021 (UTC)
- JackintheBox. Thanks for updating the map! I had to do ctrl-F5 in my Firefox browser to see it. I am curious. I know little about svg files. Where exactly do you enter new values? Can you link to the page that the svg map is pulling the data from? Are you pasting in a list, or a csv file, or what? I assume you are not entering values manually one by one? --Timeshifter (talk) 15:54, 17 June 2021 (UTC)
- @Timeshifter: I'm fairly new to making SVG maps myself, but I've created several maps in that format. I use a (free) app called Inkscape for constructing SVG maps, and yes, I manually shade each country/territory and (for the COVID map) enter each value manually as well, referring to the values in the column 'Deaths per 100,000 population' of the table under COVID-19 pandemic by country and territory#Total cases and death rates by country. For territories not included in that column (like the Falkland Islands, Bermuda, New Caledonia, Wallis and Futuna etc.) I referred to values in the 'Deaths' column of the table under COVID-19 pandemic by country and territory#Total cases and deaths, then calculated their deaths per 100,000 population using population data from Worldometer. I partly learnt how to edit SVG map files using Inkscape myself, but also had some great help from Allice Hunter! JACKINTHEBOX • TALK 16:04, 17 June 2021 (UTC)
- JackintheBox. Thanks for updating the map! I had to do ctrl-F5 in my Firefox browser to see it. I am curious. I know little about svg files. Where exactly do you enter new values? Can you link to the page that the svg map is pulling the data from? Are you pasting in a list, or a csv file, or what? I assume you are not entering values manually one by one? --Timeshifter (talk) 15:54, 17 June 2021 (UTC)
- @Timeshifter: I've finished updating the map by entering new values and re-shading some countries/territories manually on the SVG file. For territories not included in the table under 'Total cases and death rates by country', I manually calculated their values using population data from Worldometer. But thanks anyway! JACKINTHEBOX • TALK 15:24, 17 June 2021 (UTC)
- That's an idea. I will continue updating the current map in the infobox, although if it is decided the map should be replaced in the infobox, I would be fine with that too. JACKINTHEBOX • TALK 13:34, 17 June 2021 (UTC)
Unindent. I had the wrong link before. I had the graph timeline by country. Here below is the link to the table of COVID-19 death rates per million by country. It may help in updating your map:
It is continually updated. Source tab says: "Raw data on confirmed cases and deaths for all countries is sourced from the COVID-19 Data Repository by the Center for Systems Science and Engineering (CSSE) at Johns Hopkins University."
I would think there is some form or template somewhere on Wikipedia where you could paste a long list of values, and then have it converted to a list along with styling for background colors.
There are similar templates for data tables. The template is added to every cell in the table, or in a column. The template automatically adds the appropriate background color to match the value. Linked below is an example of a table with one such column. Scroll down to the main table, and look at the rate column:
It wraps the rate numbers with the {{
- {{ccolor|6.02|0|20|C0C0FF|000080}}
The rate is 6.02. The other numbers are for the data range. The color codes are for the color range. Guarapiranga knows a lot about this stuff. --Timeshifter (talk) 13:18, 18 June 2021 (UTC)
- Thanks, I'll look into it. But since I'm not very proficient in scripts for shading choropleth maps, I'll probably continue doing everything manually 😁 JACKINTHEBOX • TALK 05:49, 19 June 2021 (UTC)
Intervals of infobox map
I've just updated the infobox map for 17 June, but does anyone think the intervals for deaths per 100,000 population should be altered? Currently (only counting countries in the table under 'Total cases and death rates by country') there 50 countries in the 100+ range (with 15 over 200, and Peru at 584), 49 in 18–99.99, 42 in 3.3–17.99, 31 in 0.6–3.29, only 3 in 0.1–0.59, and 4 in <0.1. JACKINTHEBOX • TALK 05:50, 19 June 2021 (UTC)
- How about adding a couple more colors for the highest rates? Maybe orange, and then red at the highest level. I don't think most people will care how you divide up the exact numbers. I trust your judgement since you are doing all the work. But I think more intervals would be better. --Timeshifter (talk) 13:50, 19 June 2021 (UTC)
- @Timeshifter: I've followed your advice and added two shades – orange for 200–300 and red for 300+ (the previous darkest shade will remain for 100–200). Data is still as of 17 June. JACKINTHEBOX • TALK 06:15, 21 June 2021 (UTC)
- Great! Thanks. --Timeshifter (talk) 12:44, 21 June 2021 (UTC)
- @Timeshifter: I've followed your advice and added two shades – orange for 200–300 and red for 300+ (the previous darkest shade will remain for 100–200). Data is still as of 17 June. JACKINTHEBOX • TALK 06:15, 21 June 2021 (UTC)
Sort
Statistics are sorted by cases. It will be more comprehensive and more accurate to sort numbers by deaths because cases are not really total cases, but only tested cases. — Preceding unsigned comment added by 85.171.169.220 (talk) 17:40, 27 June 2021 (UTC)
Colour Highlight of Norway on Maps
Wrote this on another discussion page but feels that it is appropriate to put here too:
Question: Why isn't all parts of Norway highlighted on the map when reporting for Covid cases? On the world map for deaths, Norway (number 15; the main Norway region and its island which is slightly above it) is highlighted. So why don't the other maps have it highlighted?
Maps that does highlight all of Norway:
Number of deaths map: https://en.wikipedia.org/wiki/COVID-19_pandemic_by_country_and_territory#/media/File:COVID-19_Outbreak_World_Map_Total_Deaths_per_Capita.svg
Maps that does not highlight all of Norway:
Map 1: https://en.wikipedia.org/wiki/File:COVID-19_Outbreak_World_Map.svg
Map 2: https://en.wikipedia.org/wiki/File:COVID-19_Outbreak_World_Map.svg#/media/File:COVID-19_Outbreak_World_Map-Confirmed.svg
Map 3: https://en.wikipedia.org/wiki/File:COVID-19_Outbreak_World_Map.svg#/media/File:COVID-19_Outbreak_World_Map-Deaths.svg
Map 4: https://en.wikipedia.org/wiki/File:COVID-19_Outbreak_World_Map_per_Capita.svg
Edit: Also, there was a time when all parts of Norway was highlighted on maps as per here:
https://commons.wikimedia.org/wiki/File_talk:COVID-19_Outbreak_World_Map.svg#/media/File:COVID-19_Outbreak_World_Map_(33).svg
.svg)
115.134.100.59 (talk) 05:10, 12 July 2021 (UTC)
Worldwide viral control verses China's statistics: What makes China successful?
It's obvious that the vaccines are not working well around the world and infections and deaths are still high everywhere. How can China, a country with 1.2 billion people, have so few infections? The Chinese vaccines have proven themselves to have issues yet in China they seem to work considering the statistics on infections and deaths there. What makes China so successful? And why isn't this China story being covered by the international news on a regular basis? 2405:9800:BA00:4199:11FC:2ED0:5075:8D1A (talk) 23:25, 29 July 2021 (UTC)
- The vaccines are, by and large, working well though they don't entirely stop the virus replicating (mostly in people's noses?) and being passed on. This is shown by the large reductions in deaths in countries where they have high vaccination rates. But there is a significant amount of resentment, especially in the West, against China, which is not being helped by their lack of openness in getting to the root of the outbreak. So many people don't want to learn from China. But China experienced the original SARS and other epidemics whereas Europe and America haven't for a long time and their public health systems are often out of date. Chris55 (talk) 13:39, 26 August 2021 (UTC)
Russian cases
Russia published/corrected case numbers this August, among others >50,000 covid related deaths for July alone and a total of >365,000 (See [3]).--Kmhkmh (talk) 01:24, 31 August 2021 (UTC)
Deletion discussion concerning all monthly data pages for deaths and cases
See: Wikipedia:Articles for deletion/COVID-19 pandemic deaths in July 2021. The discussion there has expanded beyond that monthly data page to all the monthly data pages linked from here:
My comment there:
Keep. Notability is obvious since it is
People at the deletion discussion may not understand these issues as well as the people here at COVID-19 pandemic by country and territory. So please get involved. --Timeshifter (talk) 06:47, 27 August 2021 (UTC)
- All the monthly death data pages were deleted. The closing admin gave his reasons here:
- User talk:Sandstein/Archives/2021/September#Wikipedia:Articles for deletion/COVID-19 pandemic deaths in July 2021
- That discussion will probably be archived soon. Check the talk archives then.
- Further discussion may happen here:
- Talk:COVID-19 pandemic deaths#Monthly cumulative death pages with daily data have been deleted. Need external links. Section name may be changed, so look around for a similar section heading. --Timeshifter (talk) 15:02, 6 September 2021 (UTC)
Antarctica cases
This article is dated one day after that cited in the article and says that Antarctica experienced 58 cases of COVID-19, more than the 36 indicated on the page. https://www.abc.net.au/news/2020-12-23/more-covid-cases-linked-to-chilean-antarctic-base/13009706 — Preceding unsigned comment added by 217.23.233.124 (talk) 14:57, 20 August 2021 (UTC)
death number for France
the death number for France is incorrect in the paragraph "COVID-19 pandemic by location as of 2 September 2021" — Preceding unsigned comment added by 2a01:cb14:aa2:7800:b1b6:7a86:8953:5318 (talk) 08:13, 3 September 2021 (UTC)
Which number is correct, then? --2A02:AB04:2AB:700:581B:6985:D8DA:95B7 (talk) 16:31, 6 September 2021 (UTC)